ml-pipeline-nyc-taxi-trip-duration
NYC Taxi Trip Duration: an end-to-end, tested ML pipeline on AWS





Predicts how long a New York City taxi trip will take, from information known at pickup. Trained on 1.44 million cleaned trips: MAE 171 s (R² 0.80) on a random test split and 187 s on an honest time-based split (train January–May, test June), a 23.6% lower error than the leak-free baseline. Served as a live API and interactive map on AWS Lambda.
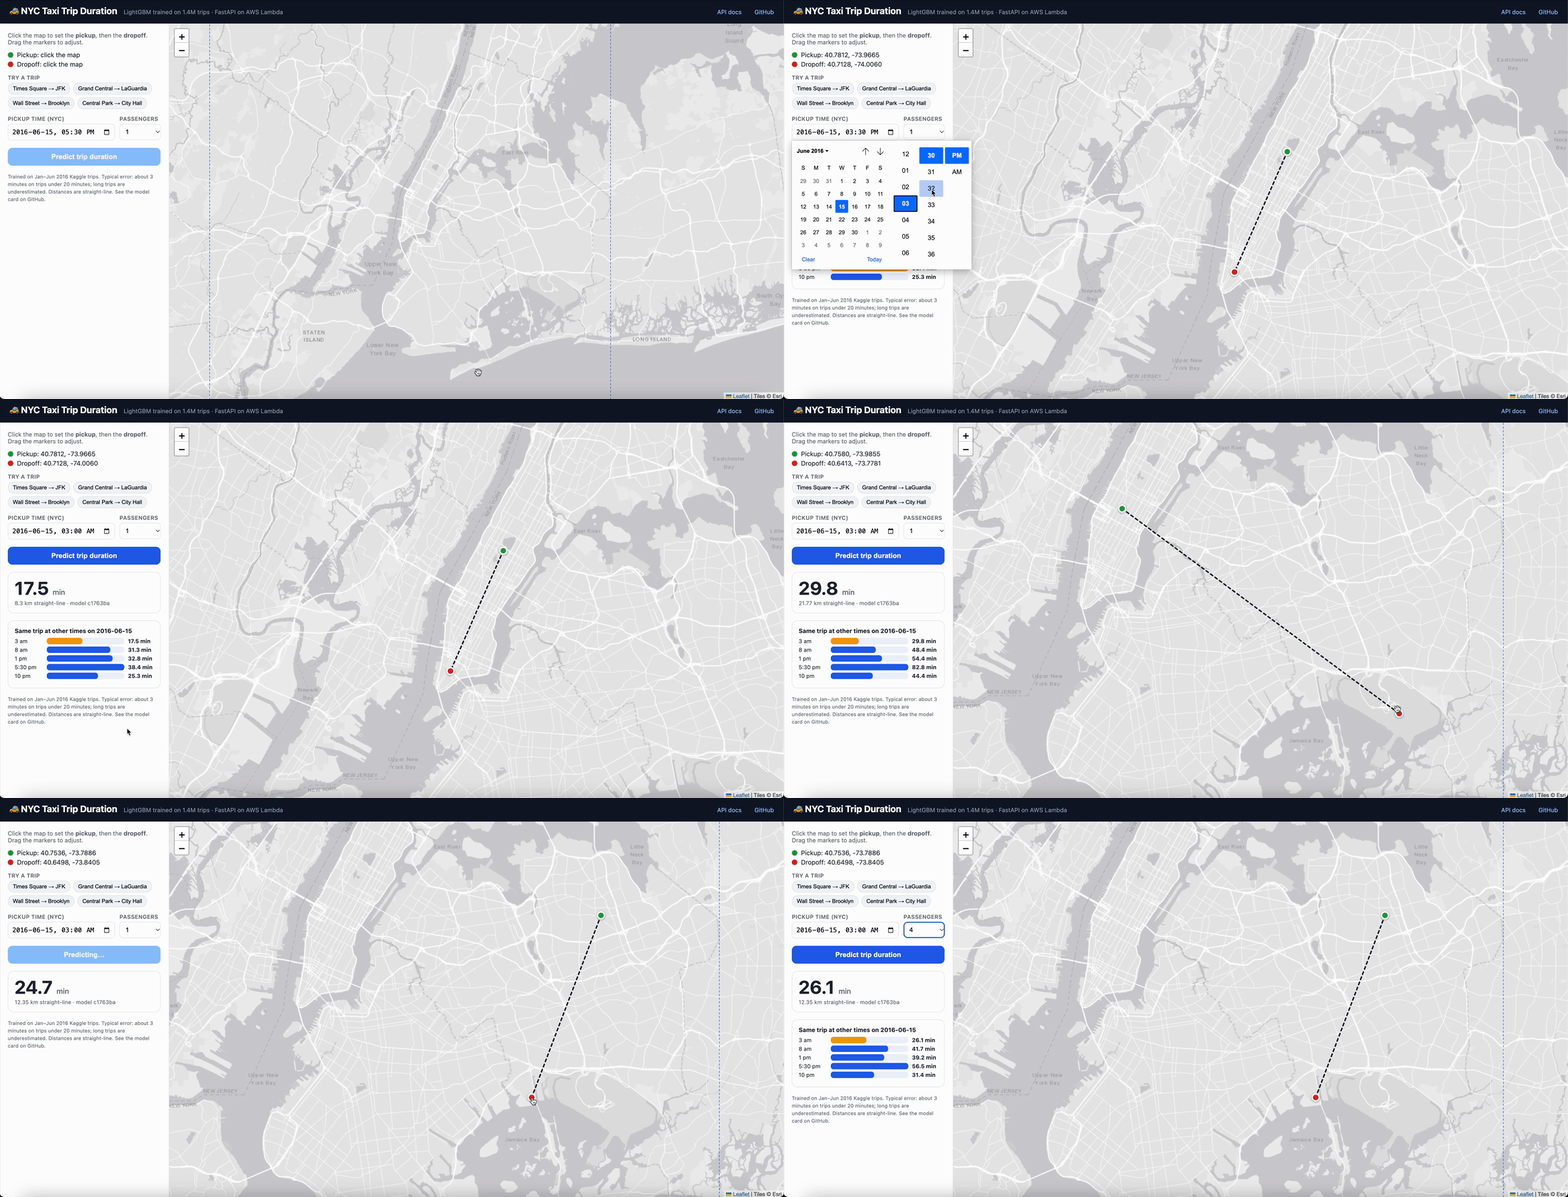
▶ Live demo: click two points on a map of NYC and get a predicted trip time · API docs · Interactive speed map · Model card
Contents
- Project overview
- Architecture
- Key findings
- Results
- Quickstart
- Prediction API
- User stories and acceptance criteria
- Data quality and testing
- SQL layer, Spark and orchestration
- Azure version
- Experiment tracking
- Limitations
- Future work
- Project structure
- Data sources and background
Project overview
The problem. Ride-hailing, dispatch and logistics teams need to know how long a trip will take before it starts, to plan vehicles, quote arrival times and spot unusual delays.
The data. 1,458,644 NYC yellow-taxi trips from January–June 2016 (Kaggle), plus daily Central Park weather from the US National Weather Service.
What this project does, from raw file to deployed service:
| Stage | What happens | Tools |
|---|---|---|
| Validate | Data contracts reject malformed or truncated files before anything else runs | pandera |
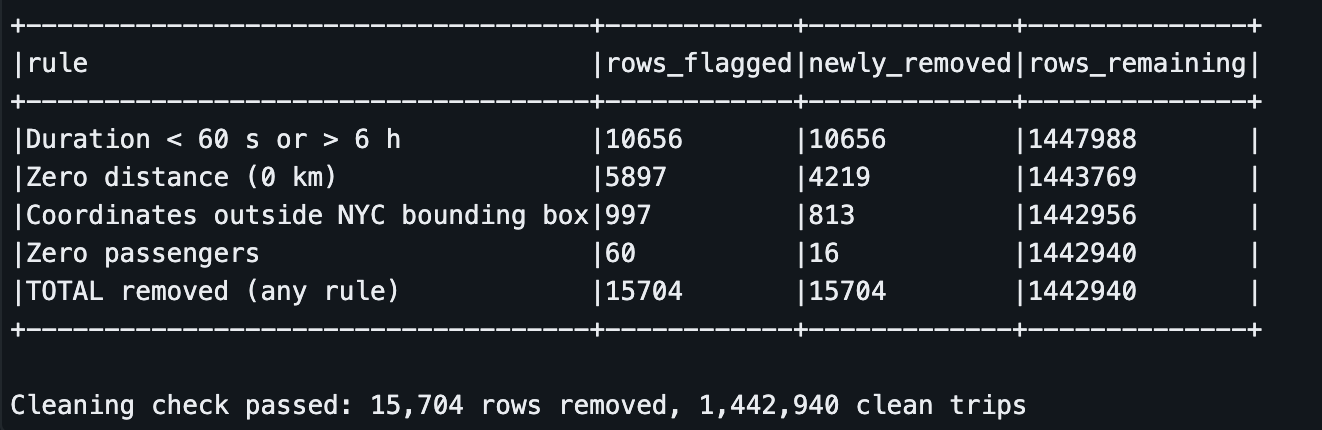
| Clean | 4 rules remove 15,704 invalid trips (1.08%); verified identical between SQL and pandas | DuckDB SQL, Parquet |
| Features | 16 leak-free features known at pickup: distances, compass bearing, time, location, airports | pandas, PySpark (cross-check) |
| Train | LightGBM on log duration; 10 experiments per run, including an honest time-based split | LightGBM, scikit-learn, MLflow |
| Explain | What drives each prediction, and where traffic is slowest | SHAP, DuckDB, folium |
| Serve | Validated REST API and an interactive map page | FastAPI, Docker, AWS Lambda, S3, ECR |
| Automate | Every push linted, tested and Docker-checked; the pipeline runs weekly as a DAG | GitHub Actions, pytest, Prefect |
Roles this project demonstrates: data science (feature engineering, leakage detection, honest evaluation, explainability), ML engineering (API, Docker, AWS, MLflow, CI/CD) and data engineering (SQL ETL, data contracts, Parquet, Spark, orchestration).
Architecture
flowchart LR
    K[Kaggle: 1.46M trips<br/>+ NWS weather] --> V[Validation<br/>pandera contracts]
    V --> C[Cleaning<br/>DuckDB SQL]
    C --> P[(Parquet)]
    P --> F[16 features]
    F --> T[LightGBM training<br/>MLflow tracking]
    F -. cross-check .-> S[PySpark ETL]
    T --> M[(Model file<br/>Amazon S3)]
    M --> L[FastAPI in Docker<br/>AWS Lambda]
    U([Browser / client]) -- map page, POST /predict --> L
    O[Prefect: weekly schedule] -. runs .-> V
    CI[GitHub Actions] -. lint, 91 tests,<br/>Docker smoke test .-> L
The same Docker image runs locally, in CI and on AWS Lambda (through the Lambda Web Adapter). The model is stored in S3 and loaded at startup; the image is stored in Amazon ECR and runs on arm64 (Graviton) in the Canada (Central) region.
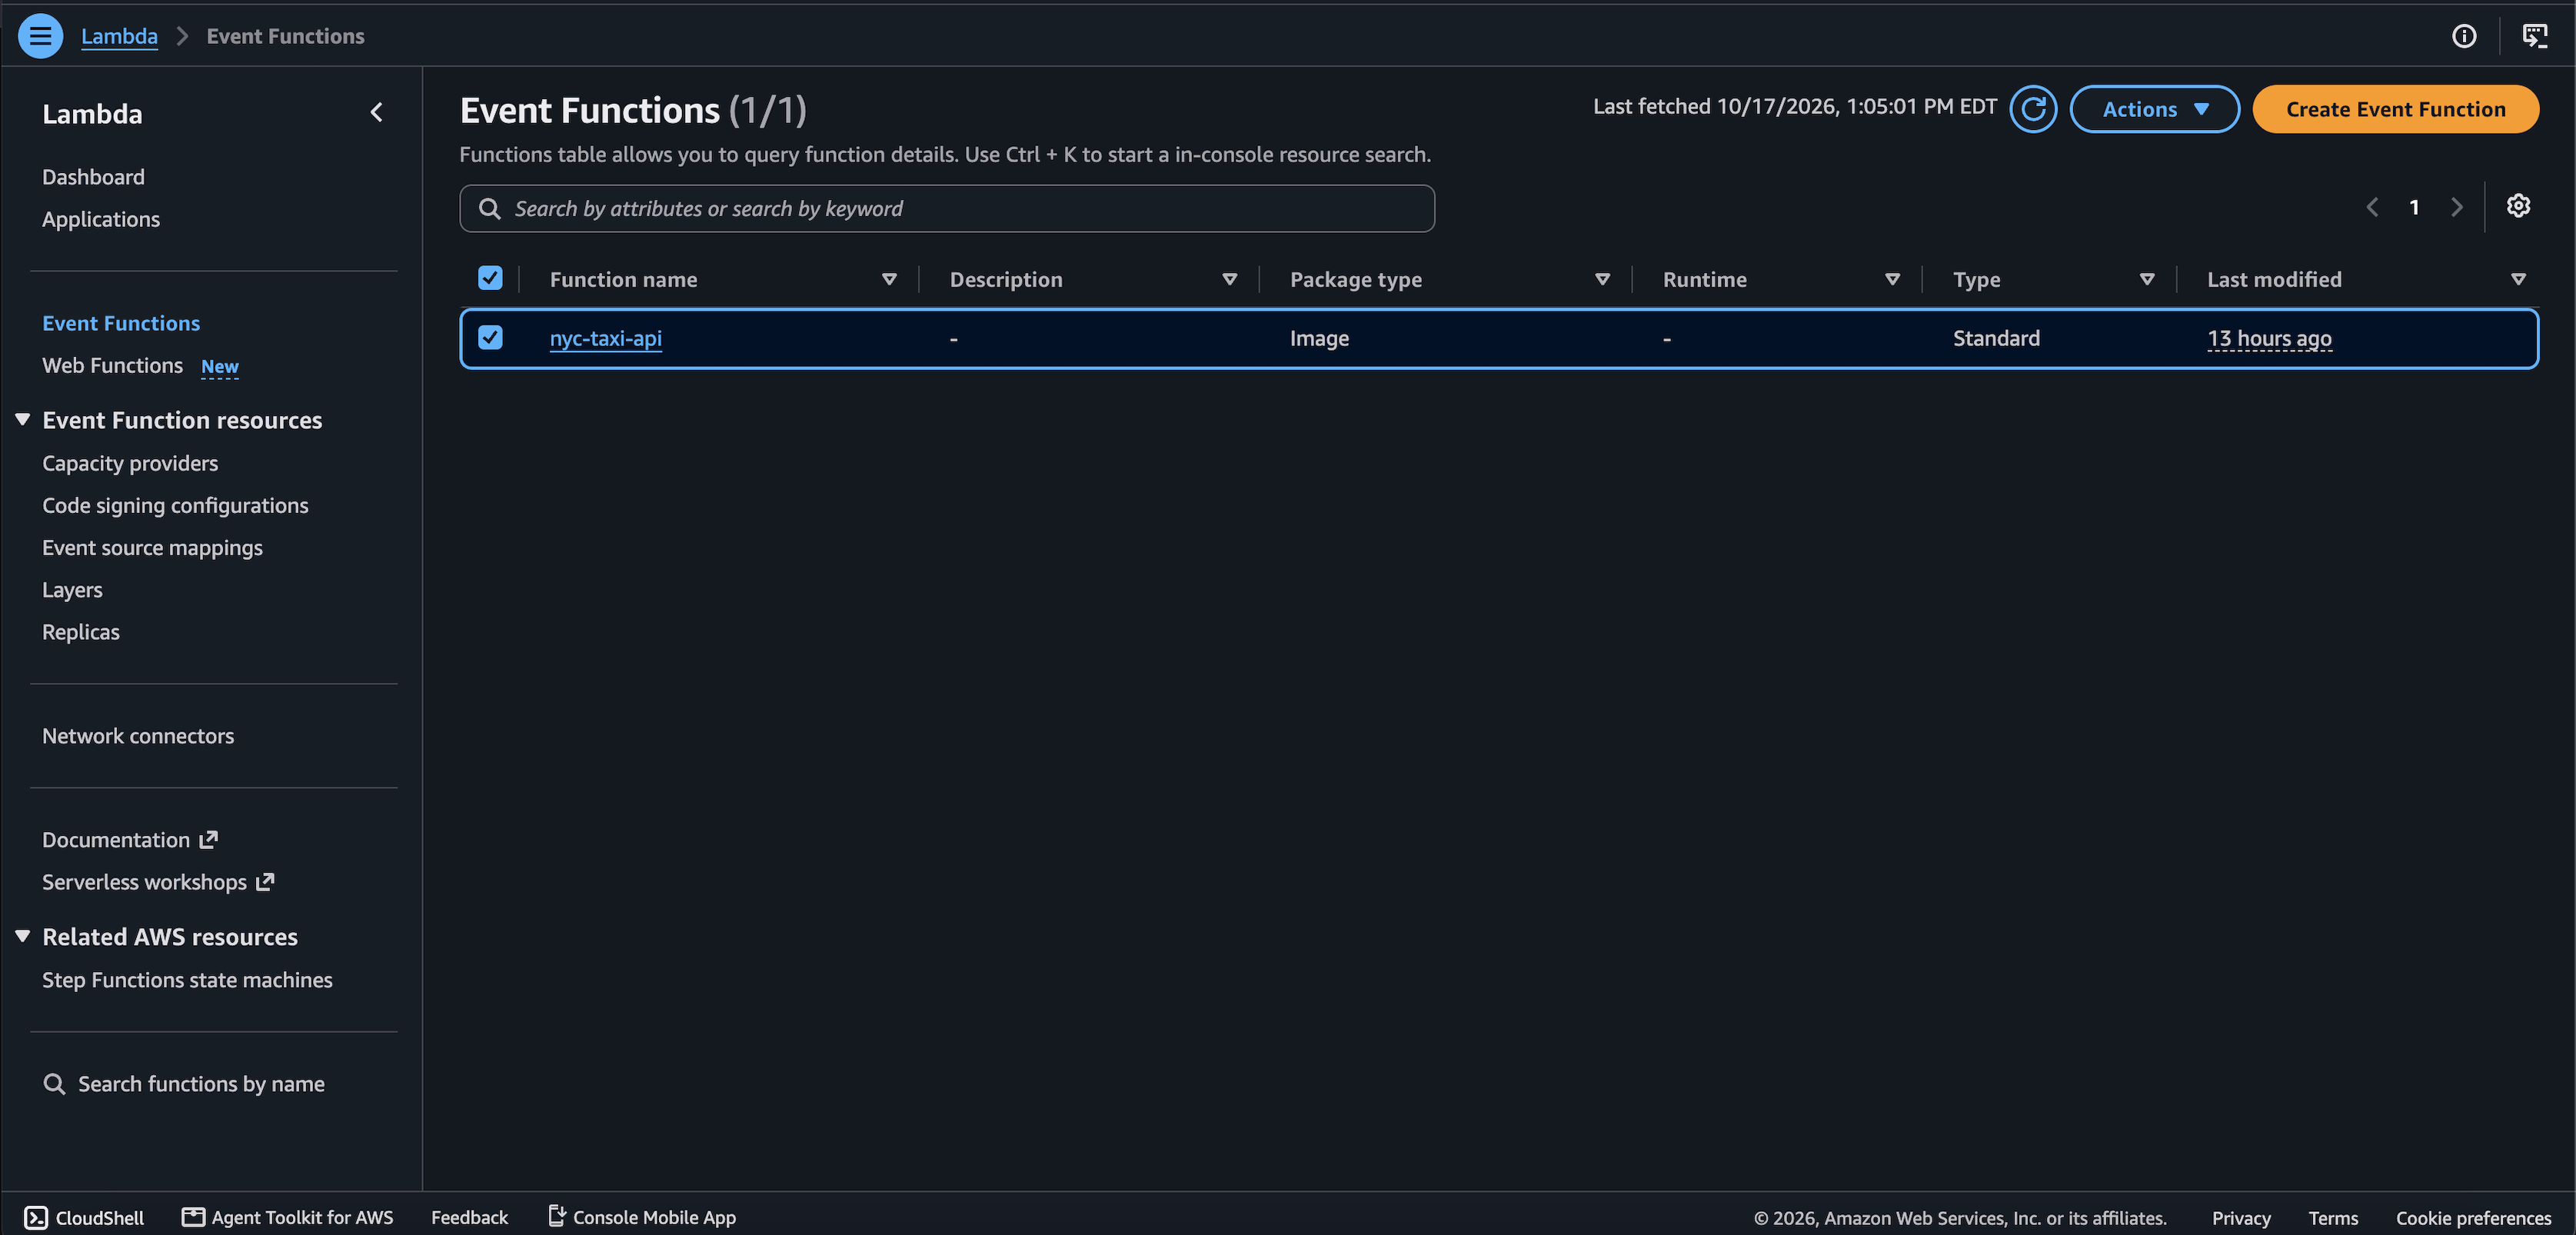 The
nyc-taxi-api function in the AWS Lambda console, deployed as a container image (package type: Image).
Key findings
- A “near-perfect” baseline was leaking the answer. The starter model scored MAE 17 s (R² 0.99) because its
speed_kmphfeature was computed from the trip duration itself. Removing it gives the honest baseline: MAE 224 s. A test and a data contract now make sure no column derived from the target can reach the model or the API. - An Excel-damaged file was caught and turned into a guardrail. An early copy of the data had exactly 1,048,575 rows (Excel’s row limit): about 410,000 trips were silently missing and every timestamp had lost its seconds. The pipeline now rejects any file with that row count, or whose dropoff − pickup times don’t match the recorded duration.
- 23.6% lower error from features and tuning. MAE fell from 223.9 s to 171.0 s: engineered features (Manhattan distance, compass bearing, airports, rush hour) gave −42.5 s; hyperparameter tuning gave −10.4 s.
- The January 2016 blizzard shows clearly in the data. The two slowest days of the six months were 25 and 26 January (27 January tied for third), just after 69 cm of snow fell on 23 January, with 23–48 cm still on the ground. Days with snow on the ground had about 16% fewer trips; rainy days were not slower at all.
- Weather looked useful but wasn’t. On a random split, adding weather improved MAE (171.0 → 167.2 s), but a day-of-year column with no weather did even better (165.8 s): the model was recognising individual days. On the honest time split, both made it worse (186.6 → 189.8 and 195.2 s), so weather is not used by the model.
Results
Model comparison (random split, 72,147 test trips)
| Model | Features | MAE (s) | RMSE (s) | RMSLE | R² |
|---|---|---|---|---|---|
| Template LightGBM (leaks the target) | 6 | 17.3 | 70.9 | 0.0603 | 0.989 |
| LightGBM, no leak (honest baseline) | 5 | 223.9 | 357.9 | 0.3934 | 0.708 |
| + engineered features | 16 | 181.4 | 311.6 | 0.3230 | 0.778 |
| Improved LightGBM (tuned) | 16 | 171.0 | 296.9 | 0.3103 | 0.799 |
| Linear Regression | 16 | 262.9 | 425.7 | 0.4332 | 0.587 |
Honest evaluation: time-based split
A random split lets the same days appear in training and test. In real use the model always predicts future trips, so it is also trained on January–May and tested on June:
| Evaluation | MAE | What it shows |
|---|---|---|
| Random split | 171.0 s | Same days in training and test |
| Random split, June trips only | 181.6 s | June trips are harder: trips got longer every month |
| Time-based split (train Jan–May, test June) | 186.6 s | The realistic estimate for future trips |
About two-thirds of the gap (+10.6 s) comes from June being a harder month, one-third (+5.0 s) from the model never having seen June.
| Weather experiment | No weather | + real weather | + day of year only |
|---|---|---|---|
| Random split | 171.0 s | 167.2 s | 165.8 s |
| Time split | 186.6 s | 189.8 s | 195.2 s |
Where the model is accurate, and where it isn’t
| Actual trip length | Share of trips | Average error | Bias |
|---|---|---|---|
| Under 20 minutes | 80% | 1.2–2.6 min | about 0 |
| 30–60 minutes | 6.9% | 7.9 min | −5.2 min |
| Over 1 hour | 0.7% | 21.6 min | −20.6 min (underestimated) |
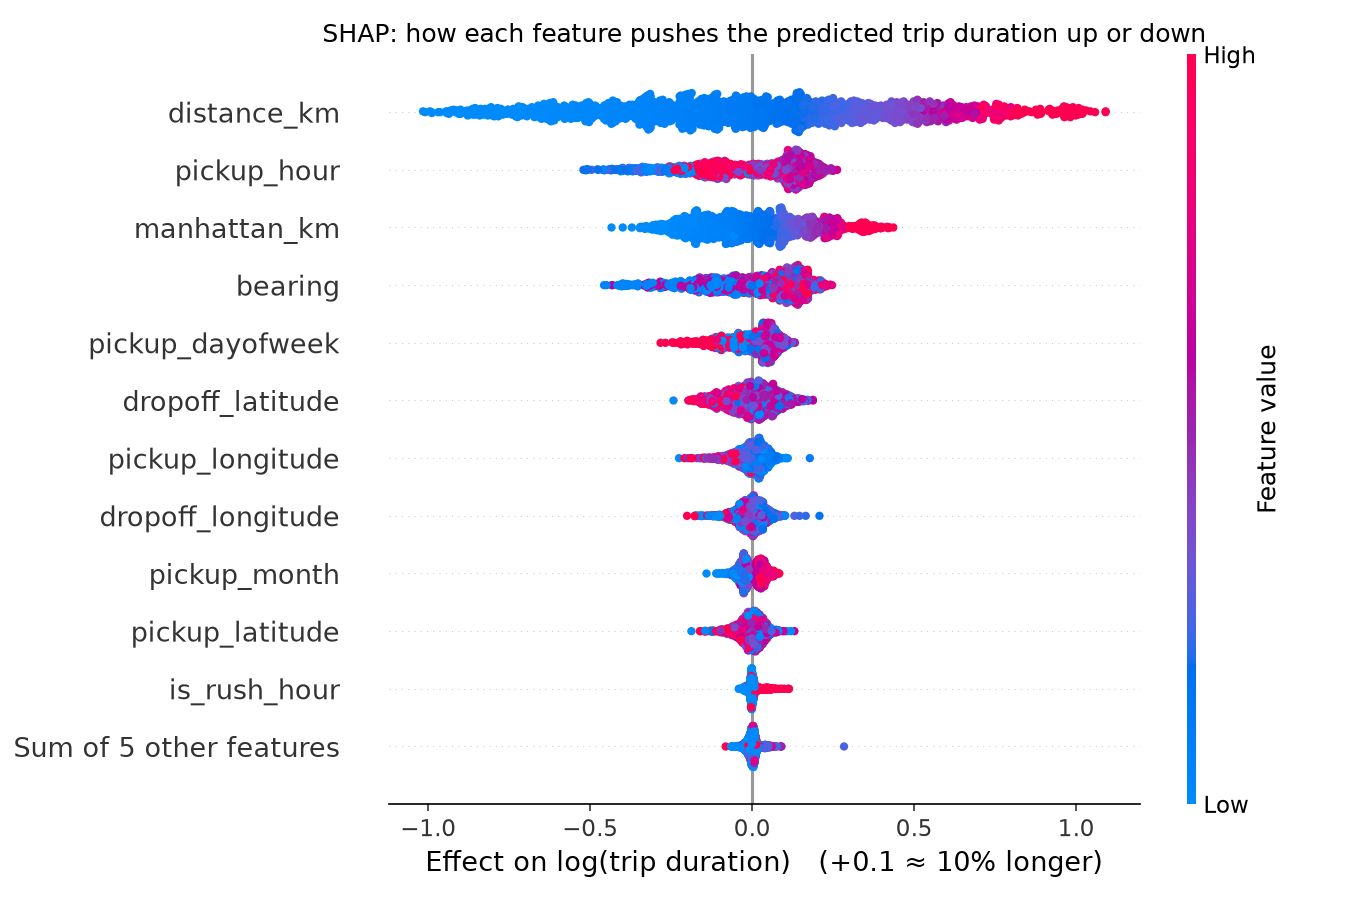
| What drives the predictions (SHAP) | Where traffic is slowest |
|---|---|
 |
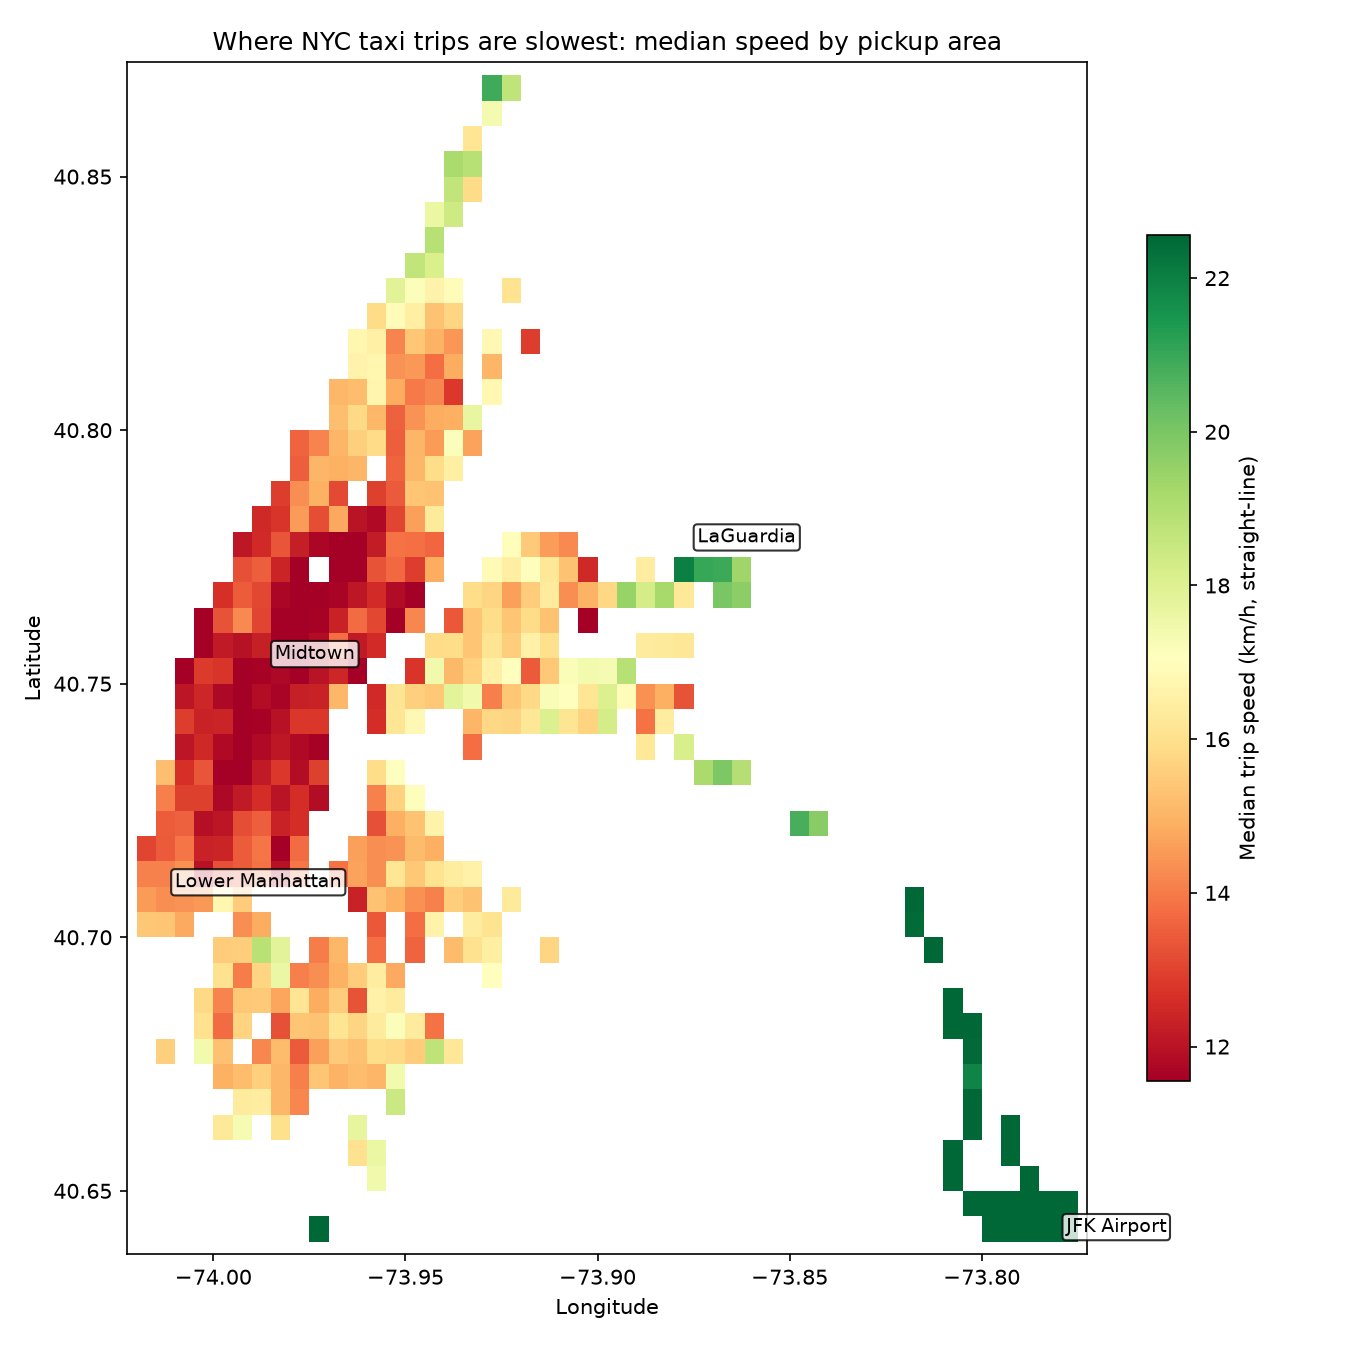 |
| Distance dominates; the pickup hour comes next. | Median trip speed by pickup area: Midtown is slowest, airport trips fastest; Central Park shows as a gap. |
| Daily traffic cycle the model learned | Predicted vs actual (10,000 test trips) |
|---|---|
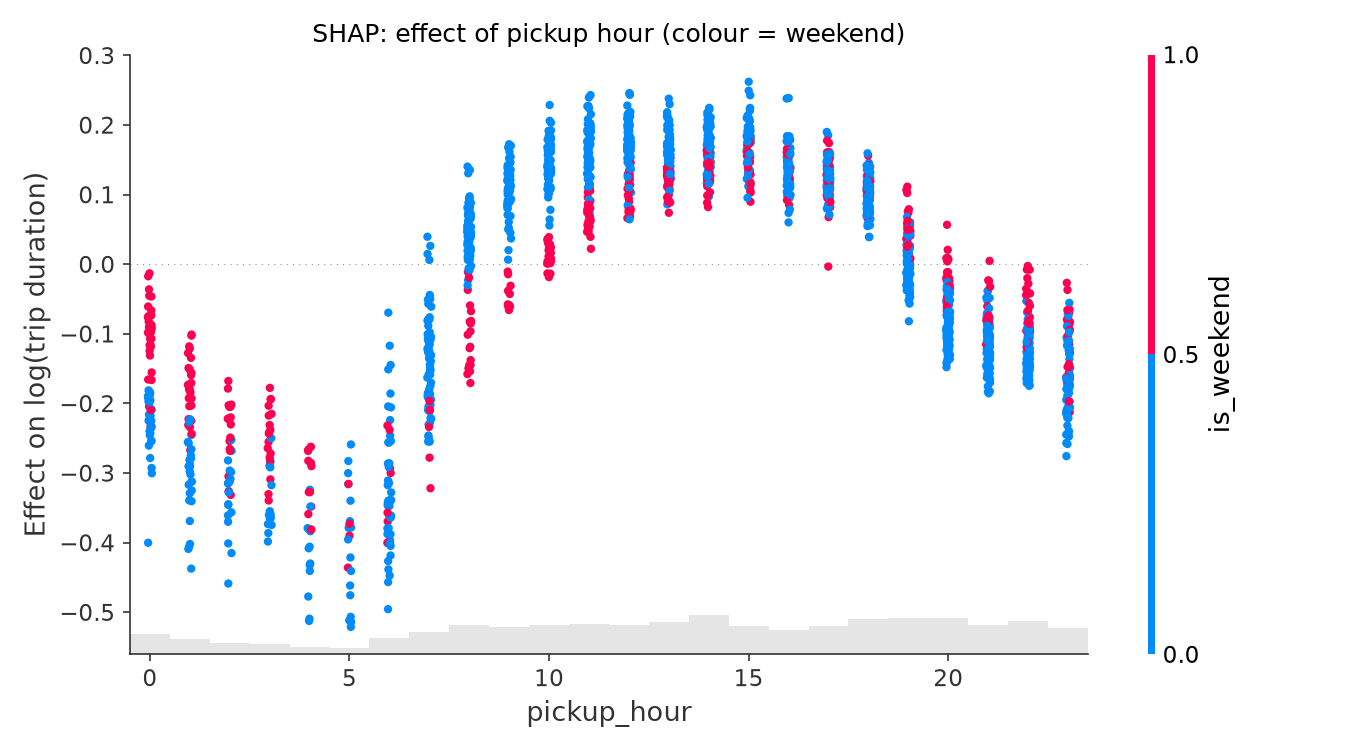 |
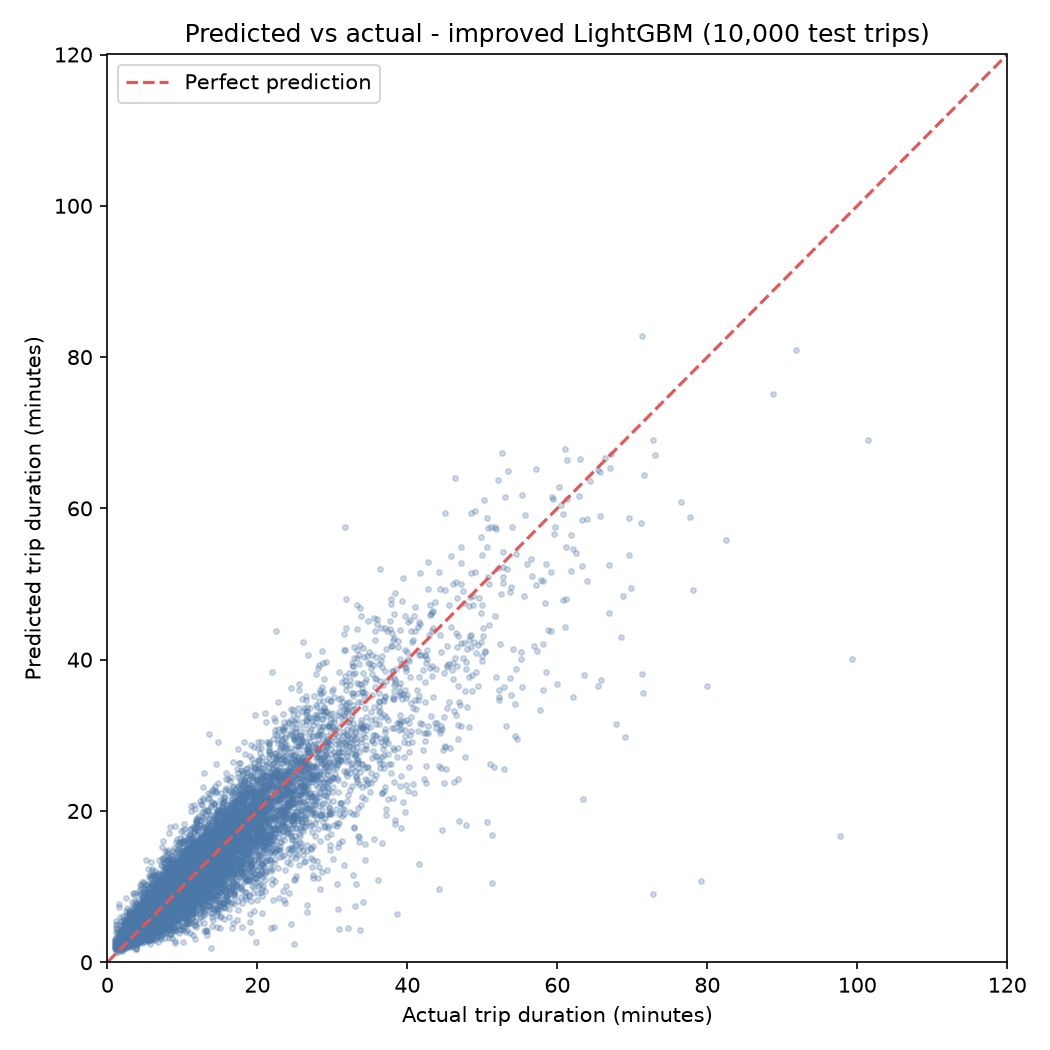 |
| Pickups at 5 a.m. are predicted about a third faster, midday about 20% slower; weekend mornings have no rush hour. | Accurate up to about 30 minutes; the longest trips fall below the diagonal. |
Full details, including the cleaning summary and known weaknesses: model card (regenerated on every pipeline run).
Quickstart
git clone https://github.com/Fatema-alam43/ml-pipeline-nyc-taxi-trip-duration.git && cd ml-pipeline-nyc-taxi-trip-duration
python -m venv .venv && source .venv/bin/activate && pip install -r requirements.txt
python scripts/download_data.py && python -m src.pipeline
download_data.py needs a Kaggle API token in ~/.kaggle/kaggle.json and the competition rules accepted. The pipeline takes a few minutes and writes the cleaned data, features, model, metrics, figures and model card. Other options:
python -m src.pipeline --fast           # only the main model
python -m src.pipeline --spark-check    # plus the PySpark cross-check (needs Java 17 or 21)
python -m flows.pipeline_flow           # run as a Prefect flow
uvicorn api.main:app --port 8080        # API and map page at http://localhost:8080
pytest                                  # 91 tests
Prediction API
Live: https://ifksrlyyuqede7xad4naehovee0qrlno.lambda-url.ca-central-1.on.aws/ (map page) · /docs (interactive documentation)
curl -X POST https://ifksrlyyuqede7xad4naehovee0qrlno.lambda-url.ca-central-1.on.aws/predict \
  -H "Content-Type: application/json" -d '{
  "pickup_latitude": 40.7580, "pickup_longitude": -73.9855,
  "dropoff_latitude": 40.6413, "dropoff_longitude": -73.7781,
  "pickup_datetime": "2016-06-15T17:30:00", "passenger_count": 1
}'
{"predicted_duration_minutes": 82.8, "predicted_duration_seconds": 4970.5, "straight_line_distance_km": 21.77,
 "model_version": "c1763ba", "warnings": []}
Invalid requests get a clear message for every problem at once:
{"error": "Invalid trip request", "details": [
  {"field": "pickup_latitude", "message": "pickup_latitude 42.5 is outside New York City (allowed 40.5 to 41.0)"},
  {"field": "passenger_count", "message": "Input should be less than or equal to 6"}]}
| Endpoint | What it does |
|---|---|
GET / |
Interactive map: click pickup and dropoff, see the prediction and the same trip at five times of day |
POST /predict |
Predicted duration (minutes and seconds), straight-line distance, model version, warnings |
GET /health |
Status, model version (git commit), SHA-256 of the model file, where it was loaded from |
GET /docs |
Interactive API documentation |
- No training/serving skew: the API computes features with the same
src/features.pycode as training, and a test checks that both produce identical values and data types for the same trips. - Input validation (Pydantic): coordinates outside NYC, passenger counts outside 1–6, identical pickup and dropoff, and unknown fields (such as
trip_duration) are rejected. Pickups outside the training months return a warning. - Operations: one JSON log line per request in CloudWatch, a request ID on every response, a non-root container, a model fingerprint in
/health, and a minimal IAM role that can only read the model file. Deploy and teardown scripts:deploy/, guide:docs/deploy_aws.md.
# Run with Docker
docker build --build-arg PYTHON_VERSION=$(cat .python-version) -t nyc-taxi-api .
docker run -p 8080:8080 -v "$(pwd)/models:/models:ro" -e MODEL_PATH=/models/lgbm_improved.txt nyc-taxi-api
User stories and acceptance criteria
Each criterion is checked by an automated test or a measured result.
1. As a dispatcher, I want an estimated trip time before the trip starts, so that I can plan vehicles and tell customers when they will arrive.
- ✅
POST /predictreturns minutes from pickup and dropoff coordinates, pickup time and passengers, and nothing that is only known after the trip - ✅ Typical error under 3 minutes on the 80% of trips shorter than 20 minutes
- ✅ Available on a public HTTPS URL, with the model version in every response
2. As an API user, I want clear errors for invalid input, so that I can fix my request instead of receiving a meaningless prediction.
- ✅ Coordinates outside NYC, passenger counts outside 1–6 and identical pickup/dropoff return HTTP 422 with one message per field
- ✅ Unknown fields are rejected, so the target (
trip_duration) cannot be sent to the model - ✅ Pickups outside the training period return a warning with the prediction
3. As a data engineer, I want bad input data to stop the pipeline, so that a corrupted file never reaches the model.
- ✅ A file with exactly 1,048,575 rows (Excel-truncated) is rejected
- ✅ Timestamps whose dropoff − pickup differs from the recorded duration are rejected
- ✅ Schema, type and value contracts are checked on raw, clean and feature data
- ✅ SQL and pandas cleaning give identical rows, order and distances on every run
4. As a data scientist, I want an honest estimate of performance on future trips, so that stakeholders are not misled by optimistic numbers.
- ✅ Leaky features are detected, removed and blocked by a test
- ✅ A time-based split (train January–May, test June) is reported next to the random split
- ✅ Extra data sources (weather) are tested against a control (day of year) before being adopted
5. As an ML engineer, I want reproducible, traceable experiments, so that any result can be explained and re-created.
- ✅ Every run is logged to MLflow with parameters, metrics, feature list, git commit and model file
- ✅ Package versions are pinned; the API image uses the same versions as training
- ✅ One command (
python -m src.pipeline) reproduces all results, and the model card regenerates itself
6. As a team lead, I want every change tested automatically, so that a mistake is caught before it is deployed.
- ✅ GitHub Actions runs the linter, 91 tests and a Docker build-and-request check on every push
- ✅ Changing one cleaning rule from
<to<=makes 5 tests fail (see Data quality and testing)
7. As an operations owner, I want the pipeline to run on a schedule and recover from failures, so that the model stays current without manual work.
- ✅ A Prefect flow runs weekly (Mondays 06:00, Toronto time); the download step retries automatically
- ✅ Each step reads and writes files, so a failed run can be resumed from the failed step
Data quality and testing
Data contracts (src/schemas.py, pandera):
| Stage | Contract |
|---|---|
| Raw file | Exact columns and types, unique ids, valid vendor and flag values, plausible coordinates, positive durations; rejects Excel-truncated files and damaged timestamps |
| Clean data | Every row satisfies every cleaning rule |
| Features | The 16 expected features with valid ranges, no rush hour on weekends, and no leaky columns |
Cleaning rules (all 1,458,644 raw trips):
| Rule | Flagged | Newly removed |
|---|---|---|
| Duration under 60 s or over 6 h | 10,656 | 10,656 |
| Zero distance | 5,897 | 4,219 |
| Coordinates outside NYC | 997 | 813 |
| Zero passengers | 60 | 16 |
| Total | 15,704 (1.08%) |
91 automated tests (pytest, about a minute), on synthetic test data with planted problems, so no Kaggle data is stored in the repository and every expected count is known exactly:
- haversine distance against known distances (Empire State Building → Times Square ≈ 1.07 km)
- each cleaning rule, including values exactly on the limits (60 s, longitude −73.7) that must be kept
- data contracts, the leakage guard, feature logic, every SQL query, the time-based split and SHAP values
- the API: predictions, validation, timezones, loading the model from S3, and training/serving parity
- the PySpark ETL, a full Prefect flow run, and the whole pipeline end to end
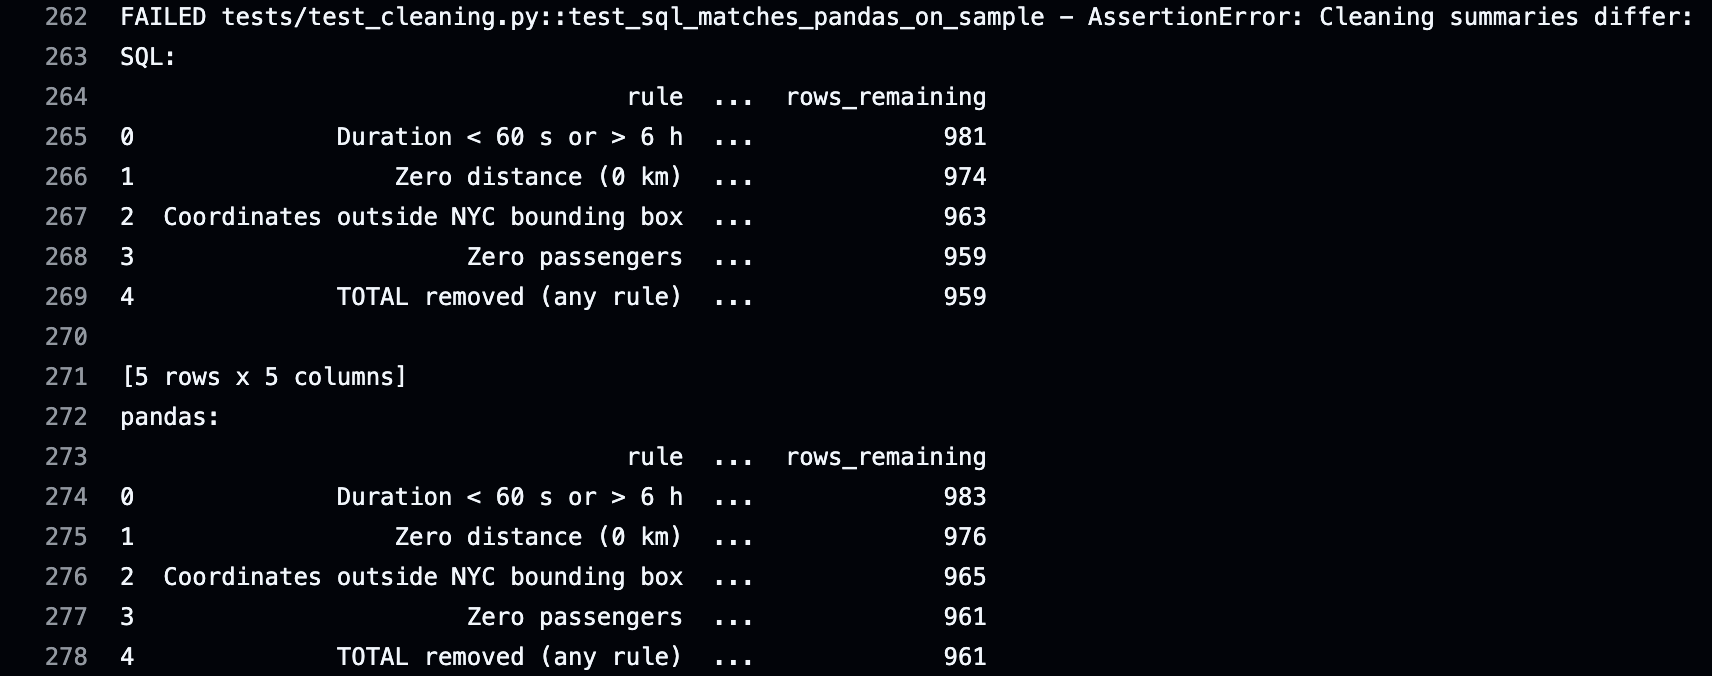
CI catches real mistakes. Changing a single character in the SQL duration rule (< to <=) makes 5 tests fail, each naming the problem:

| SQL and pandas disagree (959 vs 961 trips kept) | The whole pipeline stops: 5 failed, 55 passed |
|---|---|
 |
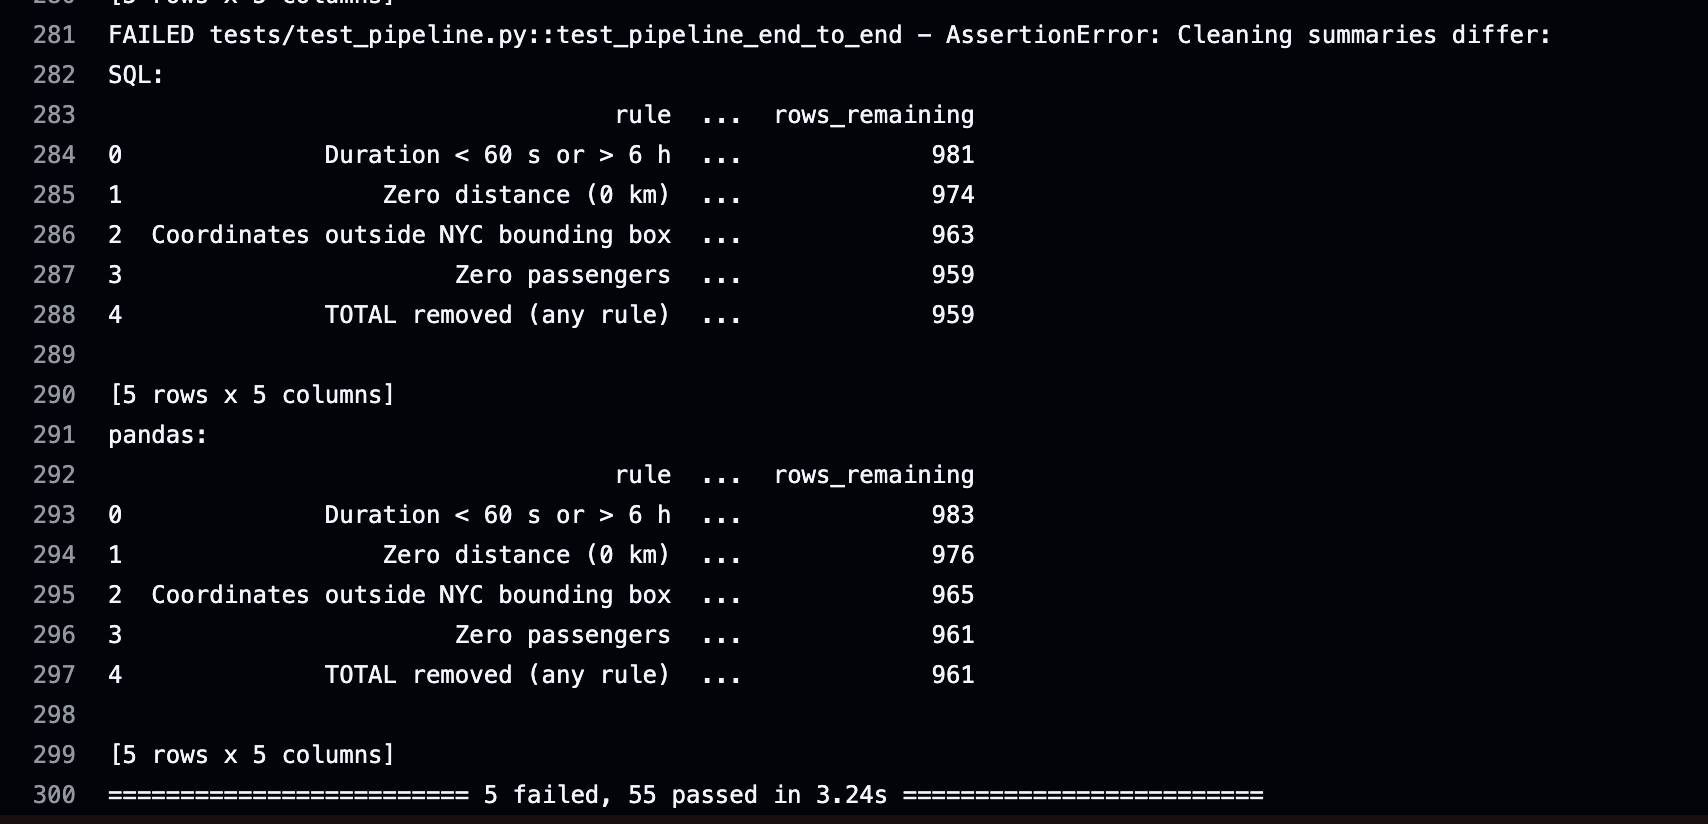 |
The SQL rule wrongly removed the 2 planted trips of exactly 60 seconds. The test for that boundary failed, and so did the independent pandas cross-check and the end-to-end pipeline test, so the mistake could not reach the model.
SQL layer, Spark and orchestration
DuckDB SQL (sql/) runs the cleaning and the analytics directly on Parquet files: CTEs, window functions (running totals, 7-day rolling averages, LAG), RANK() OVER (PARTITION BY ...) with QUALIFY, conditional aggregation with FILTER, and a reusable haversine macro.
Parquet vs CSV:
| Dataset | CSV | Parquet | Size | pandas load | DuckDB query |
|---|---|---|---|---|---|
| Raw trips | 200.6 MB | 48.0 MB | 4.2x smaller | 62.5x faster | 29.0x faster |
| Engineered features | 175.0 MB | 59.6 MB | 2.9x smaller | 55.7x faster | 39.4x faster |
PySpark (src/spark_etl.py) re-implements the cleaning and features for data too large for one machine. On all 1,458,644 trips it removes exactly the same 15,704 rows per rule, keeps the same 1,442,940 trips and produces bit-identical values for 15 of the 16 features. The compass bearing differs in 2 rows by 0.0000076°, because Java and NumPy trigonometry can differ in the last bit on Apple Silicon, so it is compared within 0.001°. Two details had to match exactly: coordinates are compared as 32-bit floats (a 64-bit limit would wrongly exclude longitude −73.7), and Spark counts weekdays from Sunday = 1 while pandas uses Monday = 0. On a single laptop DuckDB is faster; Spark pays off on a cluster.
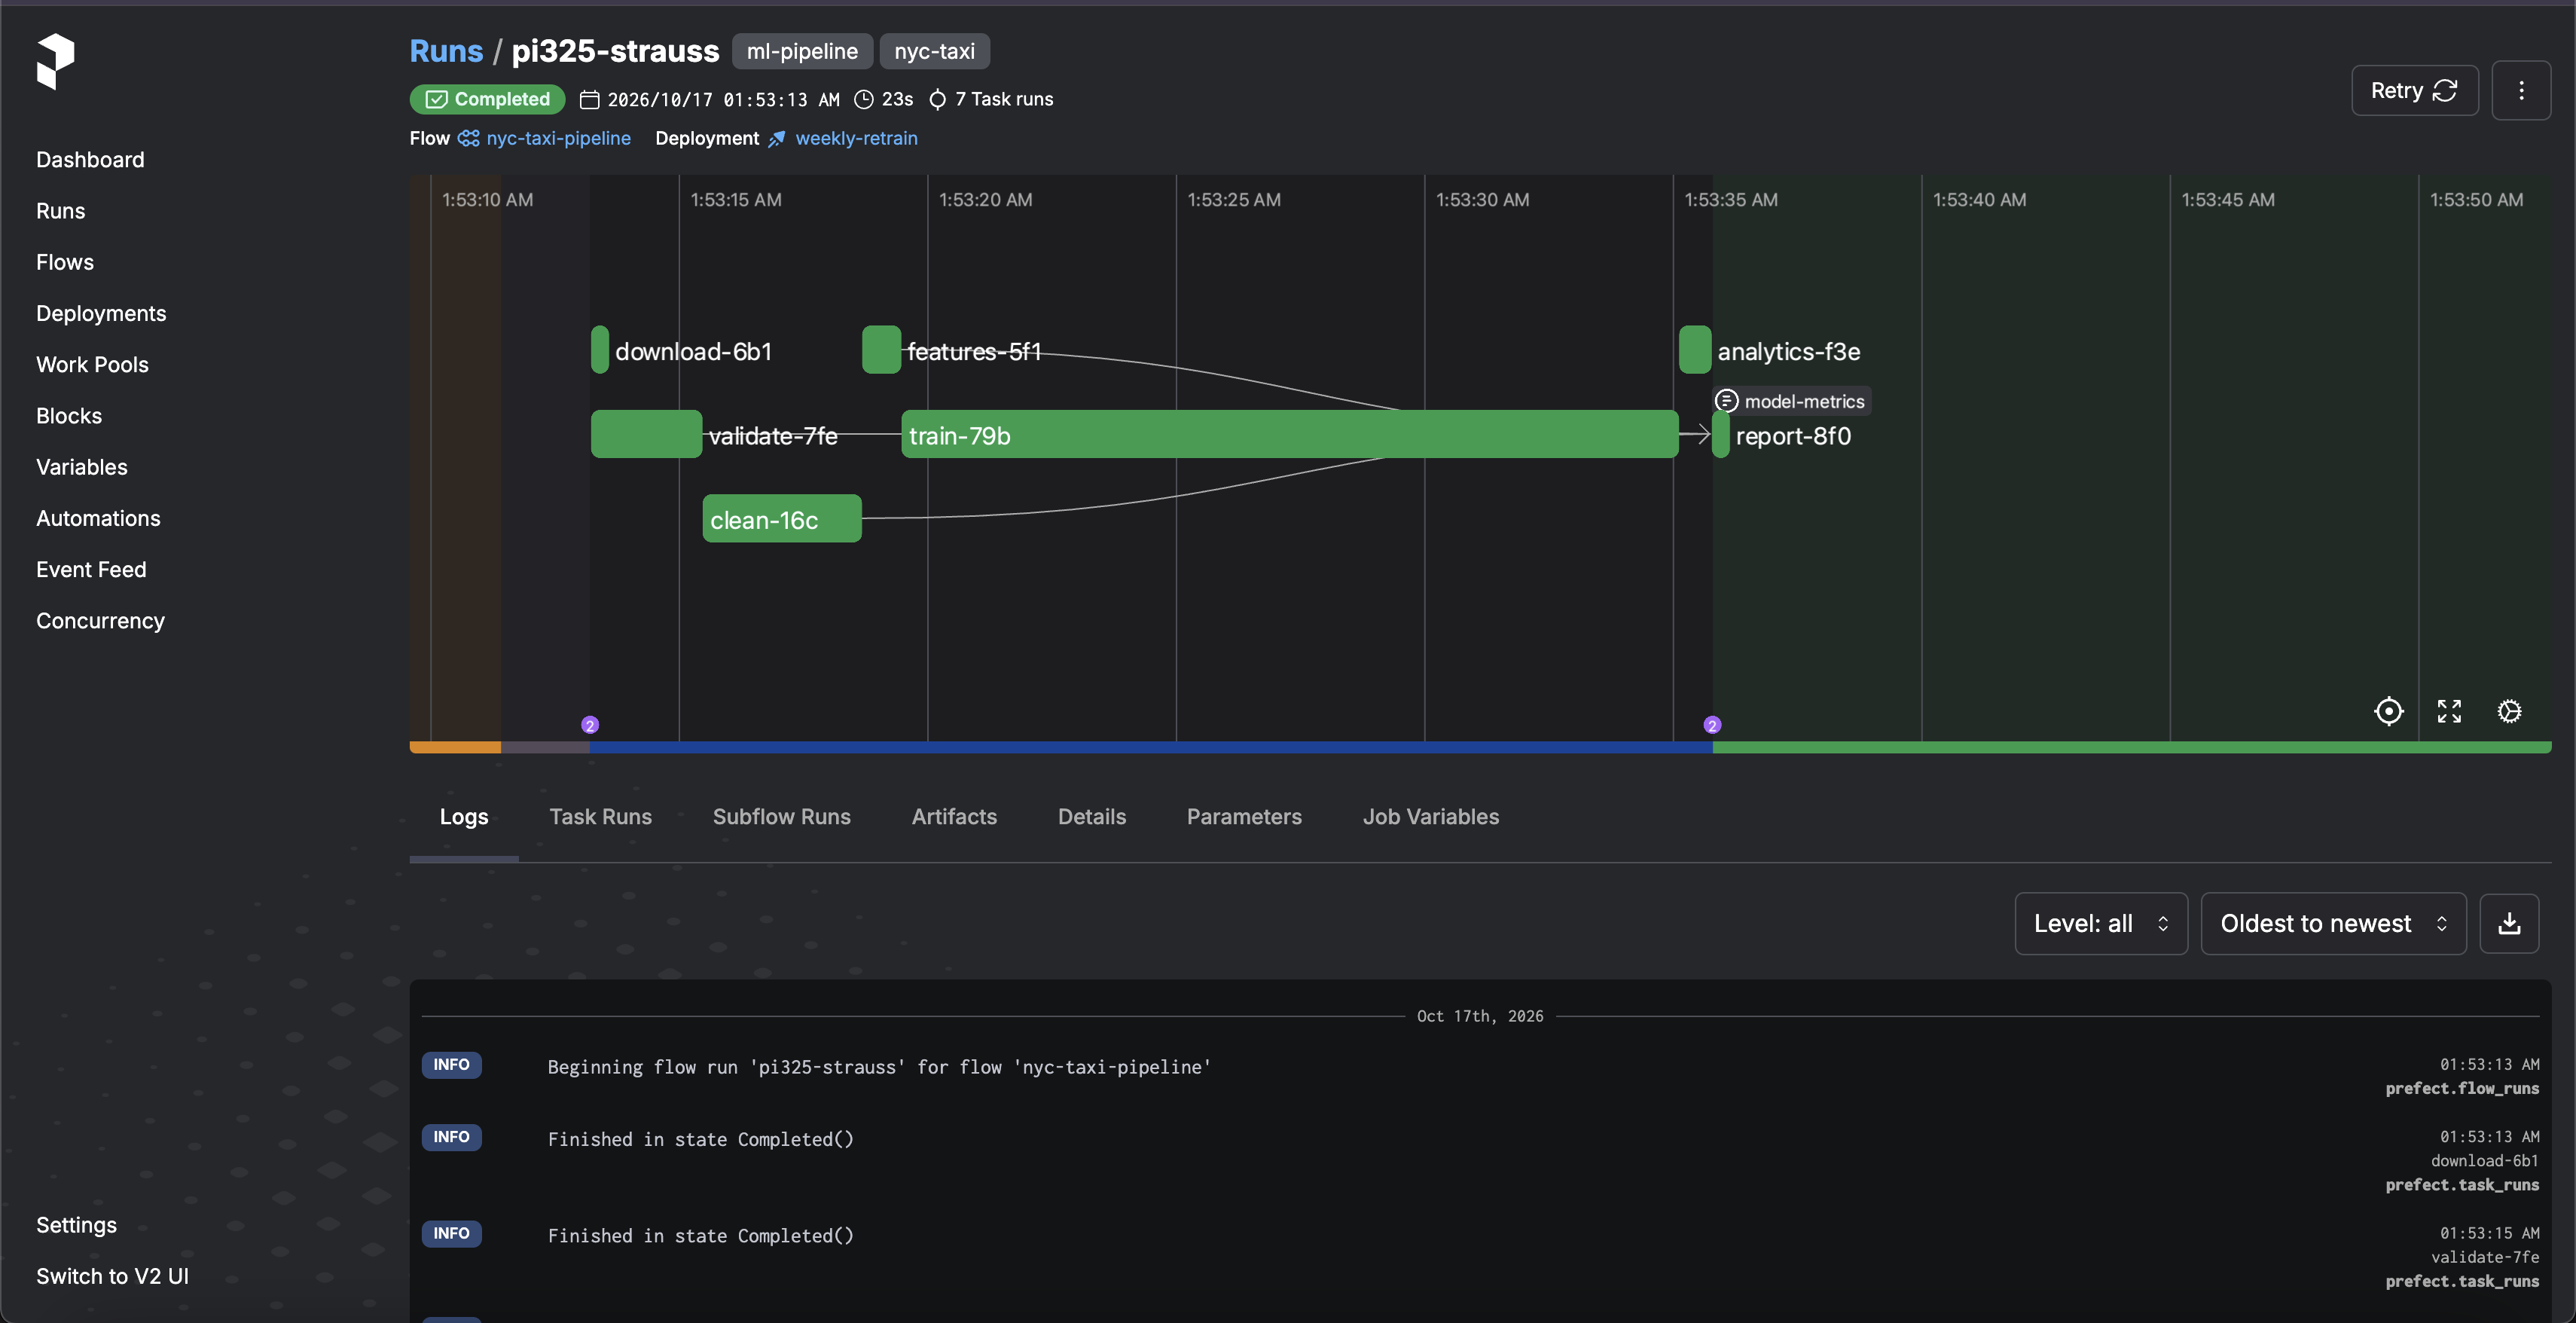
Prefect (flows/pipeline_flow.py) runs the pipeline as a scheduled DAG, every Monday at 06:00 Toronto time:
flowchart LR
    D[download<br/>retries: 2] --> V[validate] --> C[clean] --> F[features]
    F --> S[spark-crosscheck<br/>optional]
    F --> T[train] --> A[analytics] --> R[report]
Azure version: Data Factory, Databricks and Power BI
The same pipeline also runs on Microsoft Azure, as a bronze → silver → gold lakehouse, and ends in a Power BI report for business users. It removes exactly the same 15,704 rows as the local pipeline.
flowchart LR
    K[Kaggle CSVs] --> L[(ADLS Gen2<br/>landing)]
    L --> A[Data Factory<br/>copy to Parquet<br/>+ row-count check]
    A --> B[(bronze<br/>Parquet)]
    B --> D[Databricks serverless<br/>PySpark notebook]
    D --> S[(silver<br/>Delta: clean trips, features)]
    D --> G[(gold<br/>Delta + CSV: 6 summary tables)]
    G --> P[Power BI<br/>3-page report]
    T[Weekly trigger<br/>Mondays 06:00] -. runs .-> A
| Layer | Service | What happens |
|---|---|---|
| landing | Azure Data Lake Storage Gen2 | Raw Kaggle files, exactly as downloaded |
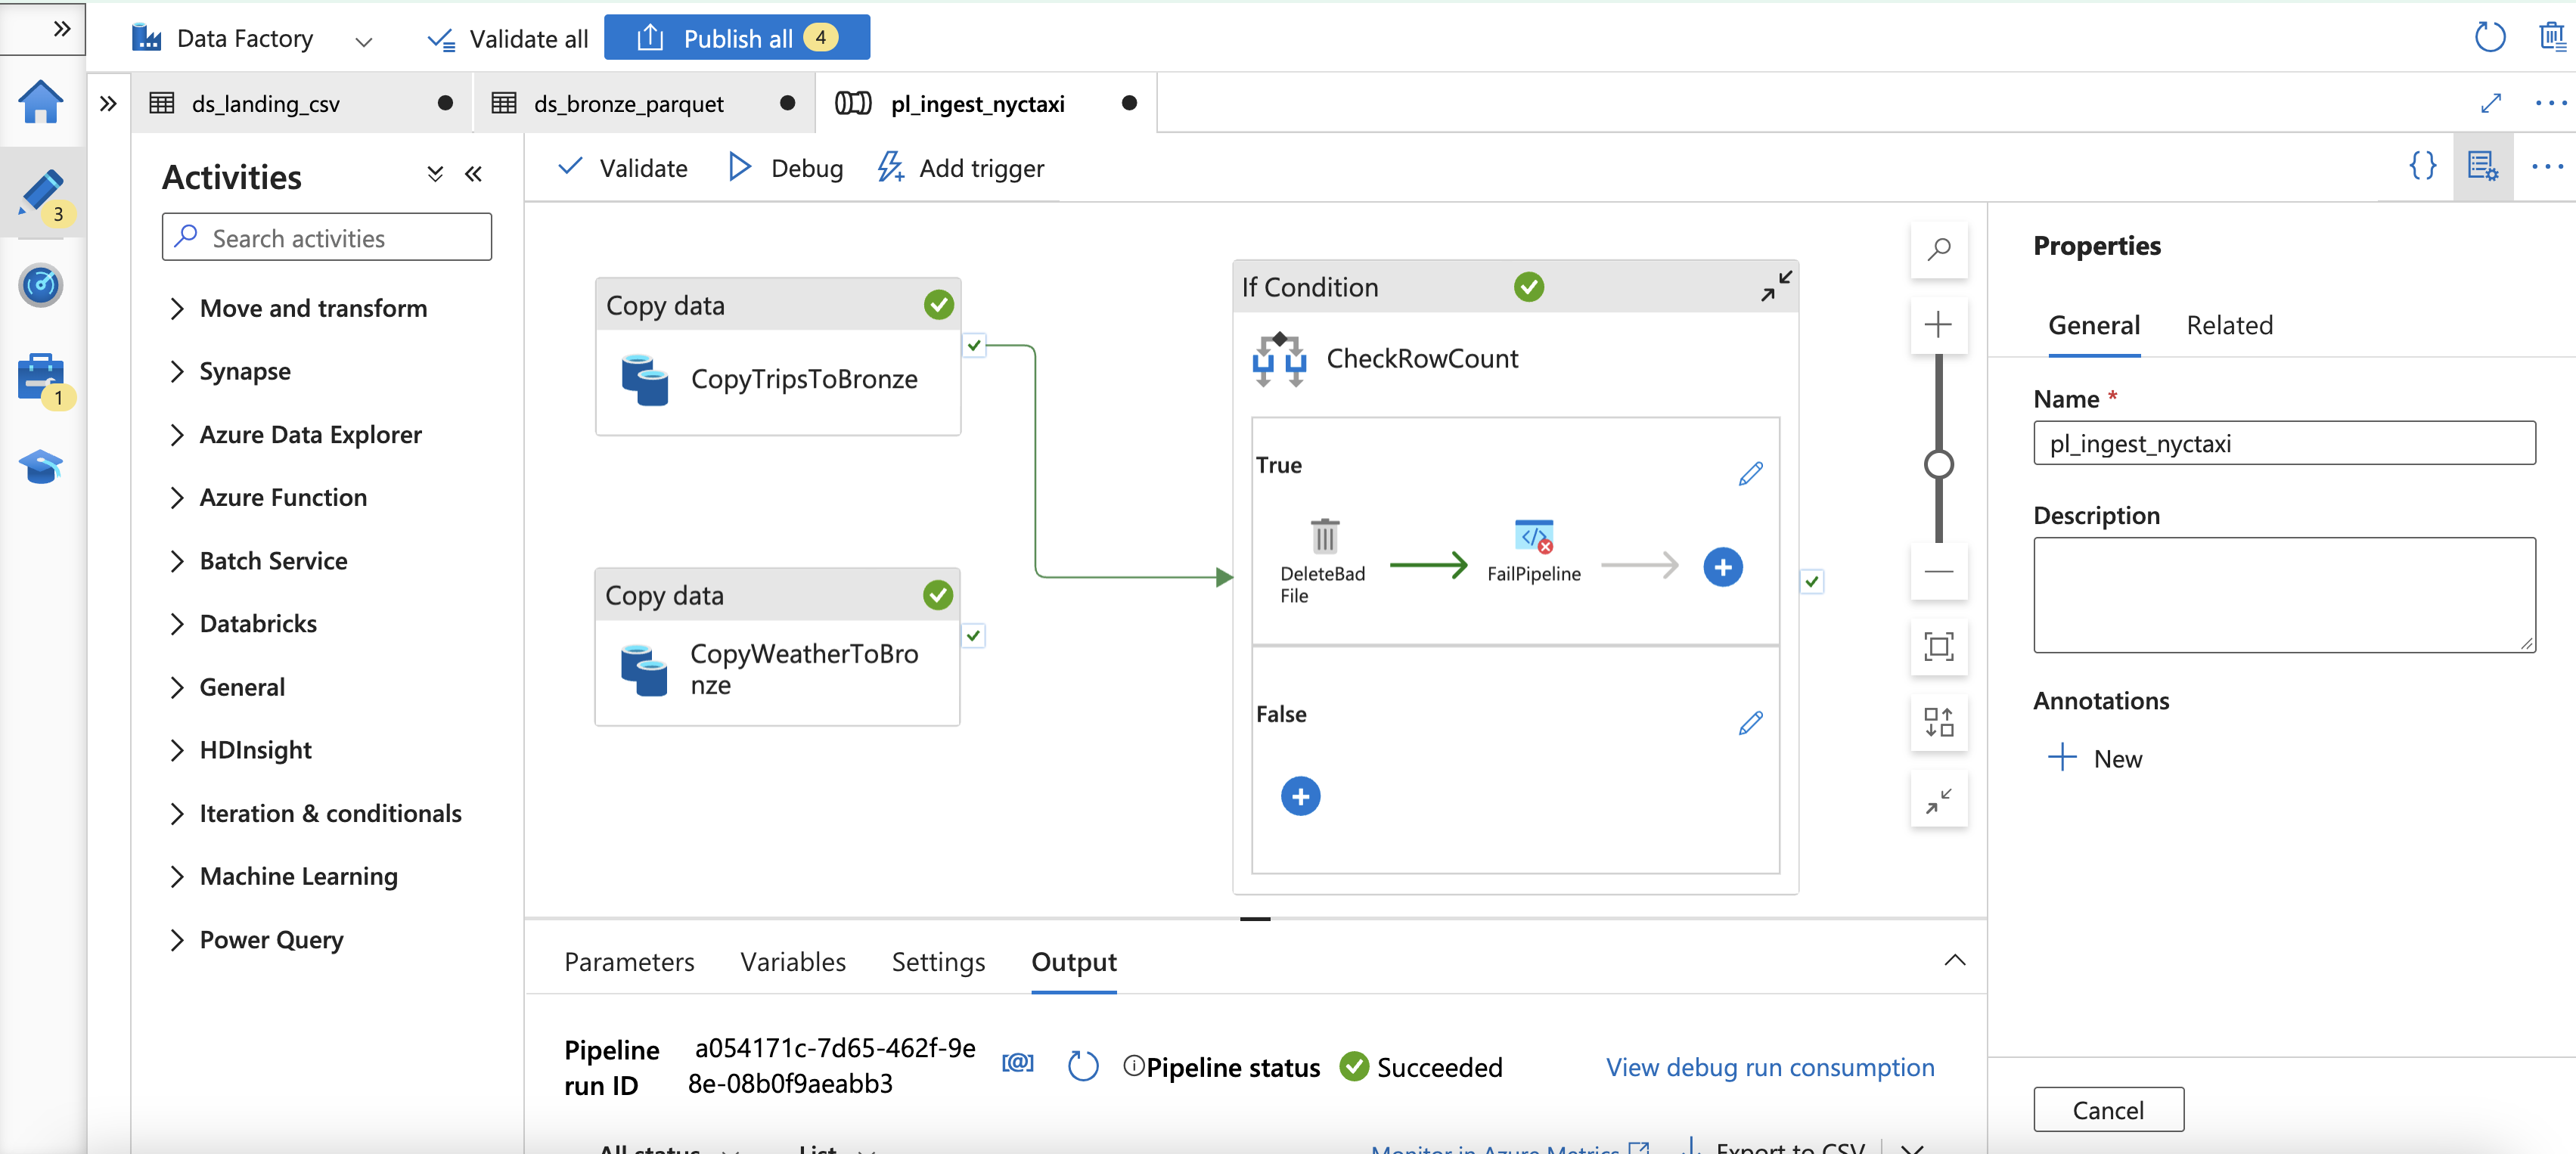
| bronze | Azure Data Factory | Copies CSV to Parquet, then checks the row count: a file with exactly 1,048,575 rows (Excel’s limit) is deleted and the pipeline fails with a clear message |
| silver | Azure Databricks (serverless, PySpark) | The same 4 cleaning rules and 16 features as the local pipeline, saved as Delta tables; the notebook fails itself unless exactly 15,704 rows are removed |
| gold | Azure Databricks | 6 small summary tables for reporting: daily KPIs with weather, hourly patterns, speed by area, airport vs other trips, weather impact, data quality |
| report | Power BI | 3 pages built on the gold tables, with a date table and DAX measures |
Same answer in four engines
The cleaning step was implemented four times and gives the same result every time:
| Engine | Rows removed | Clean trips |
|---|---|---|
| pandas | 15,704 | 1,442,940 |
| DuckDB SQL | 15,704 | 1,442,940 |
| PySpark (local) | 15,704 | 1,442,940 |
| Azure Databricks (serverless) | 15,704 | 1,442,940 |
Including the 997 trips on the edge of the NYC boundary, where a 64-bit instead of 32-bit comparison would have changed the count by one.
Data Factory: ingestion and the data-quality check
| Pipeline | Excel-truncated file rejected |
|---|---|
 |
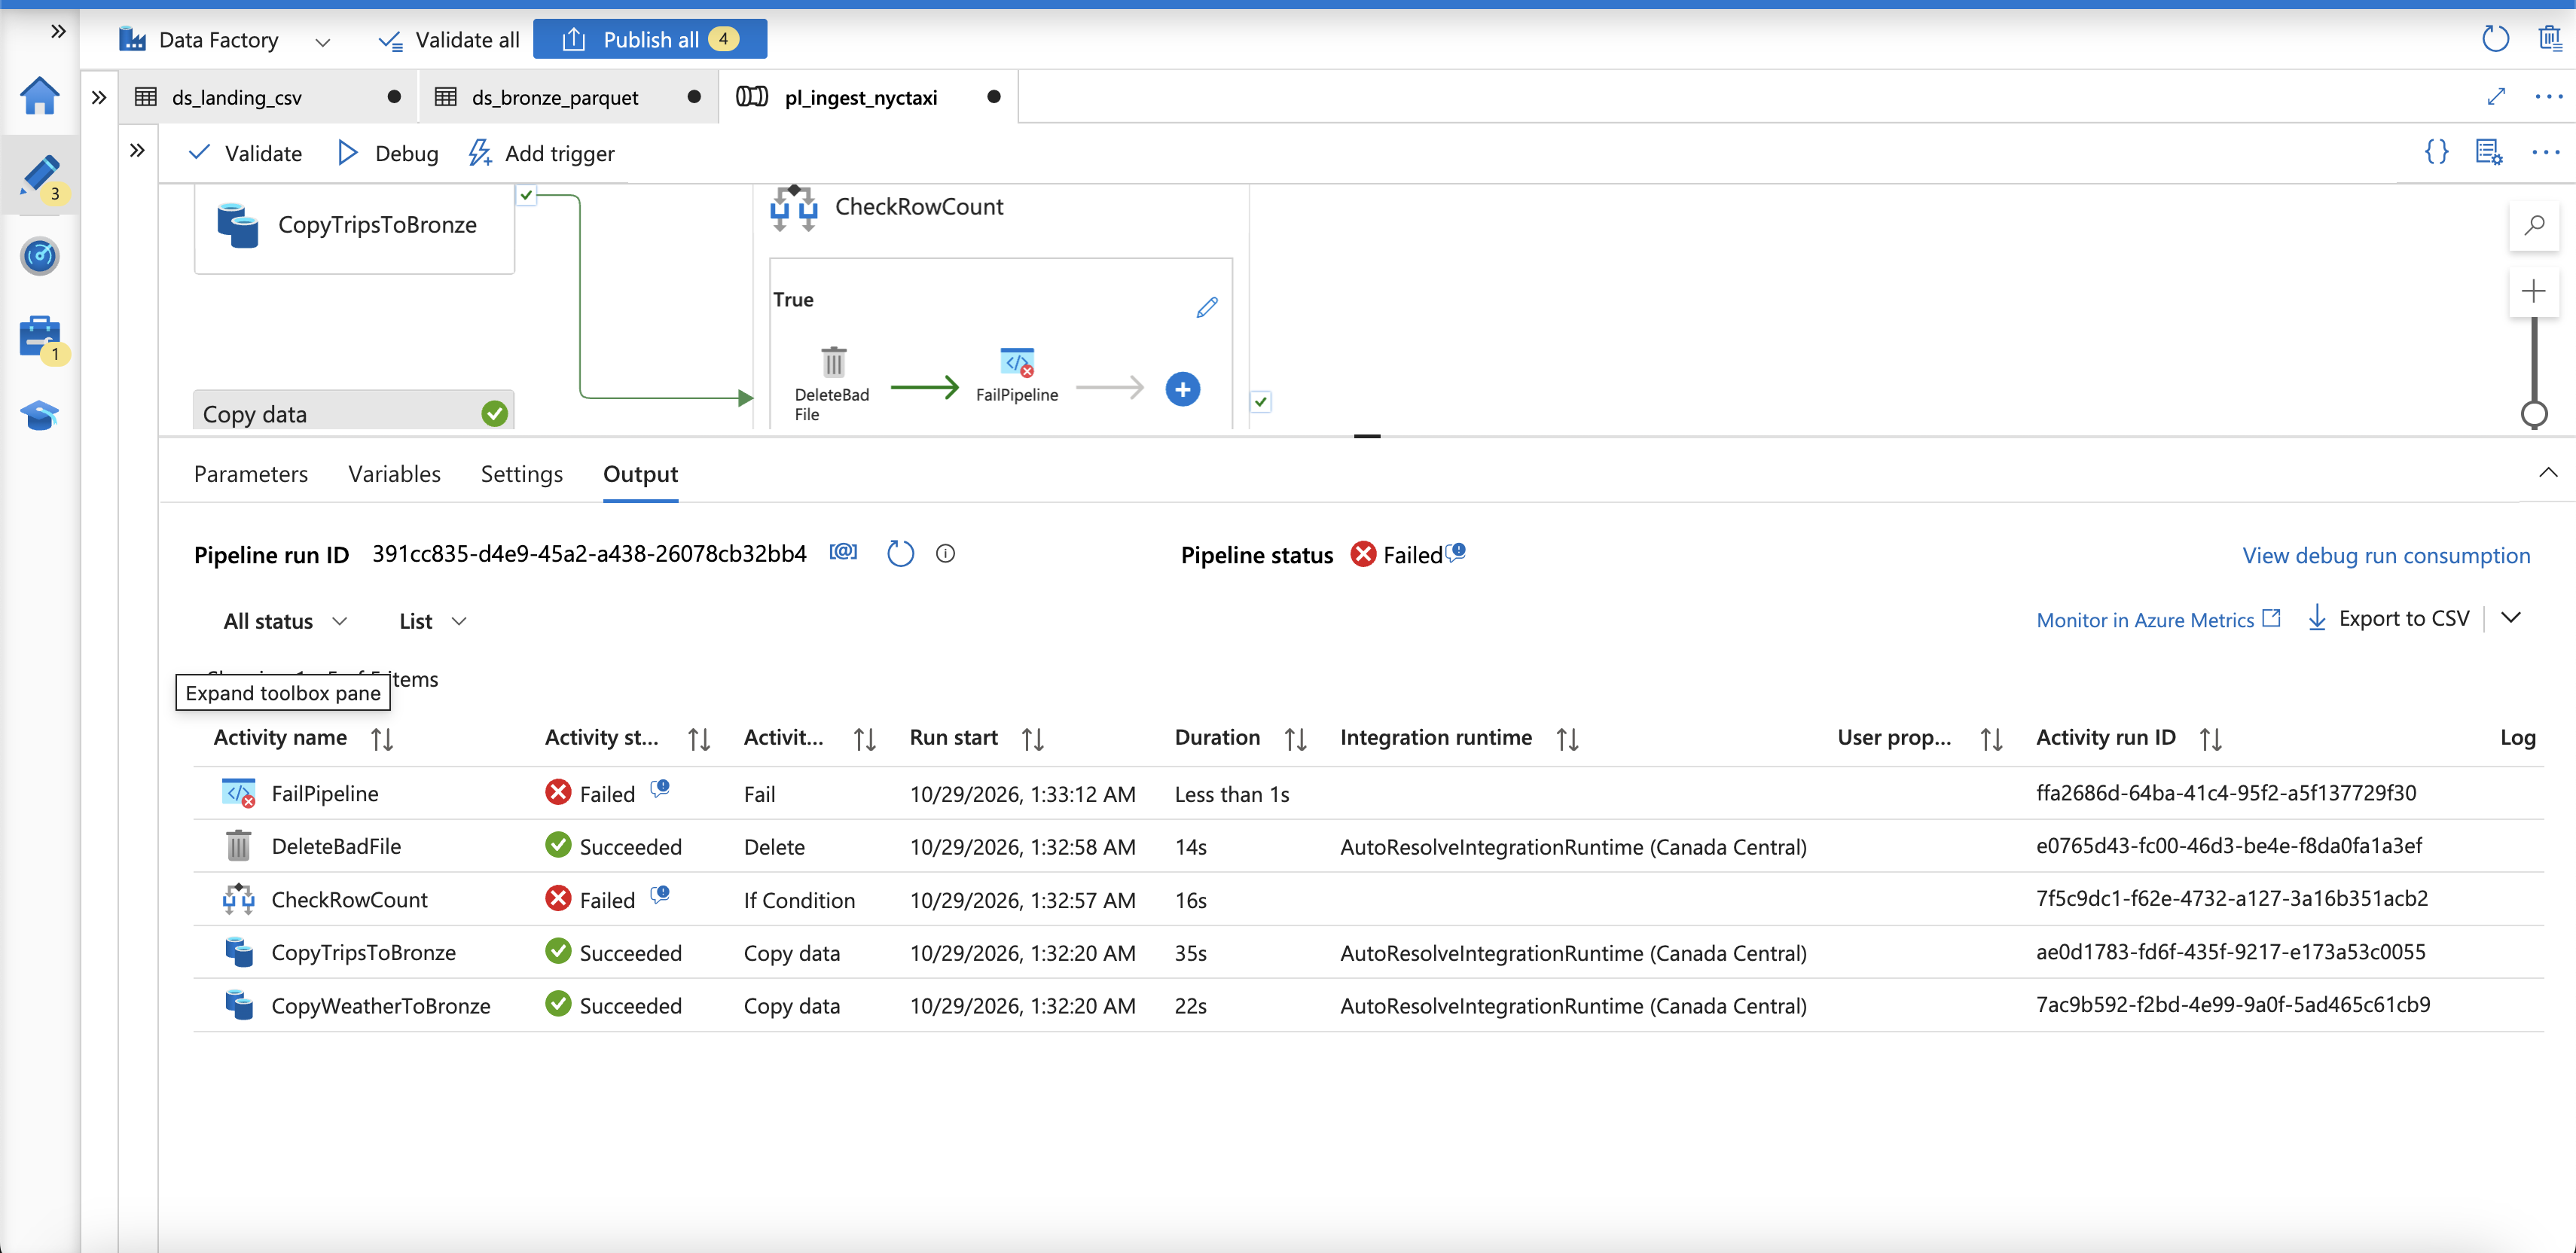 |
| Copy trips and weather to bronze as Parquet, then check the row count | Test with a 1,048,575-row file: the bad copy is deleted and the run fails on purpose |
The pipeline runs every Monday at 06:00 (Toronto time) through a schedule trigger. Pipeline, dataset, linked service and trigger definitions are in azure/adf/.
Power BI report
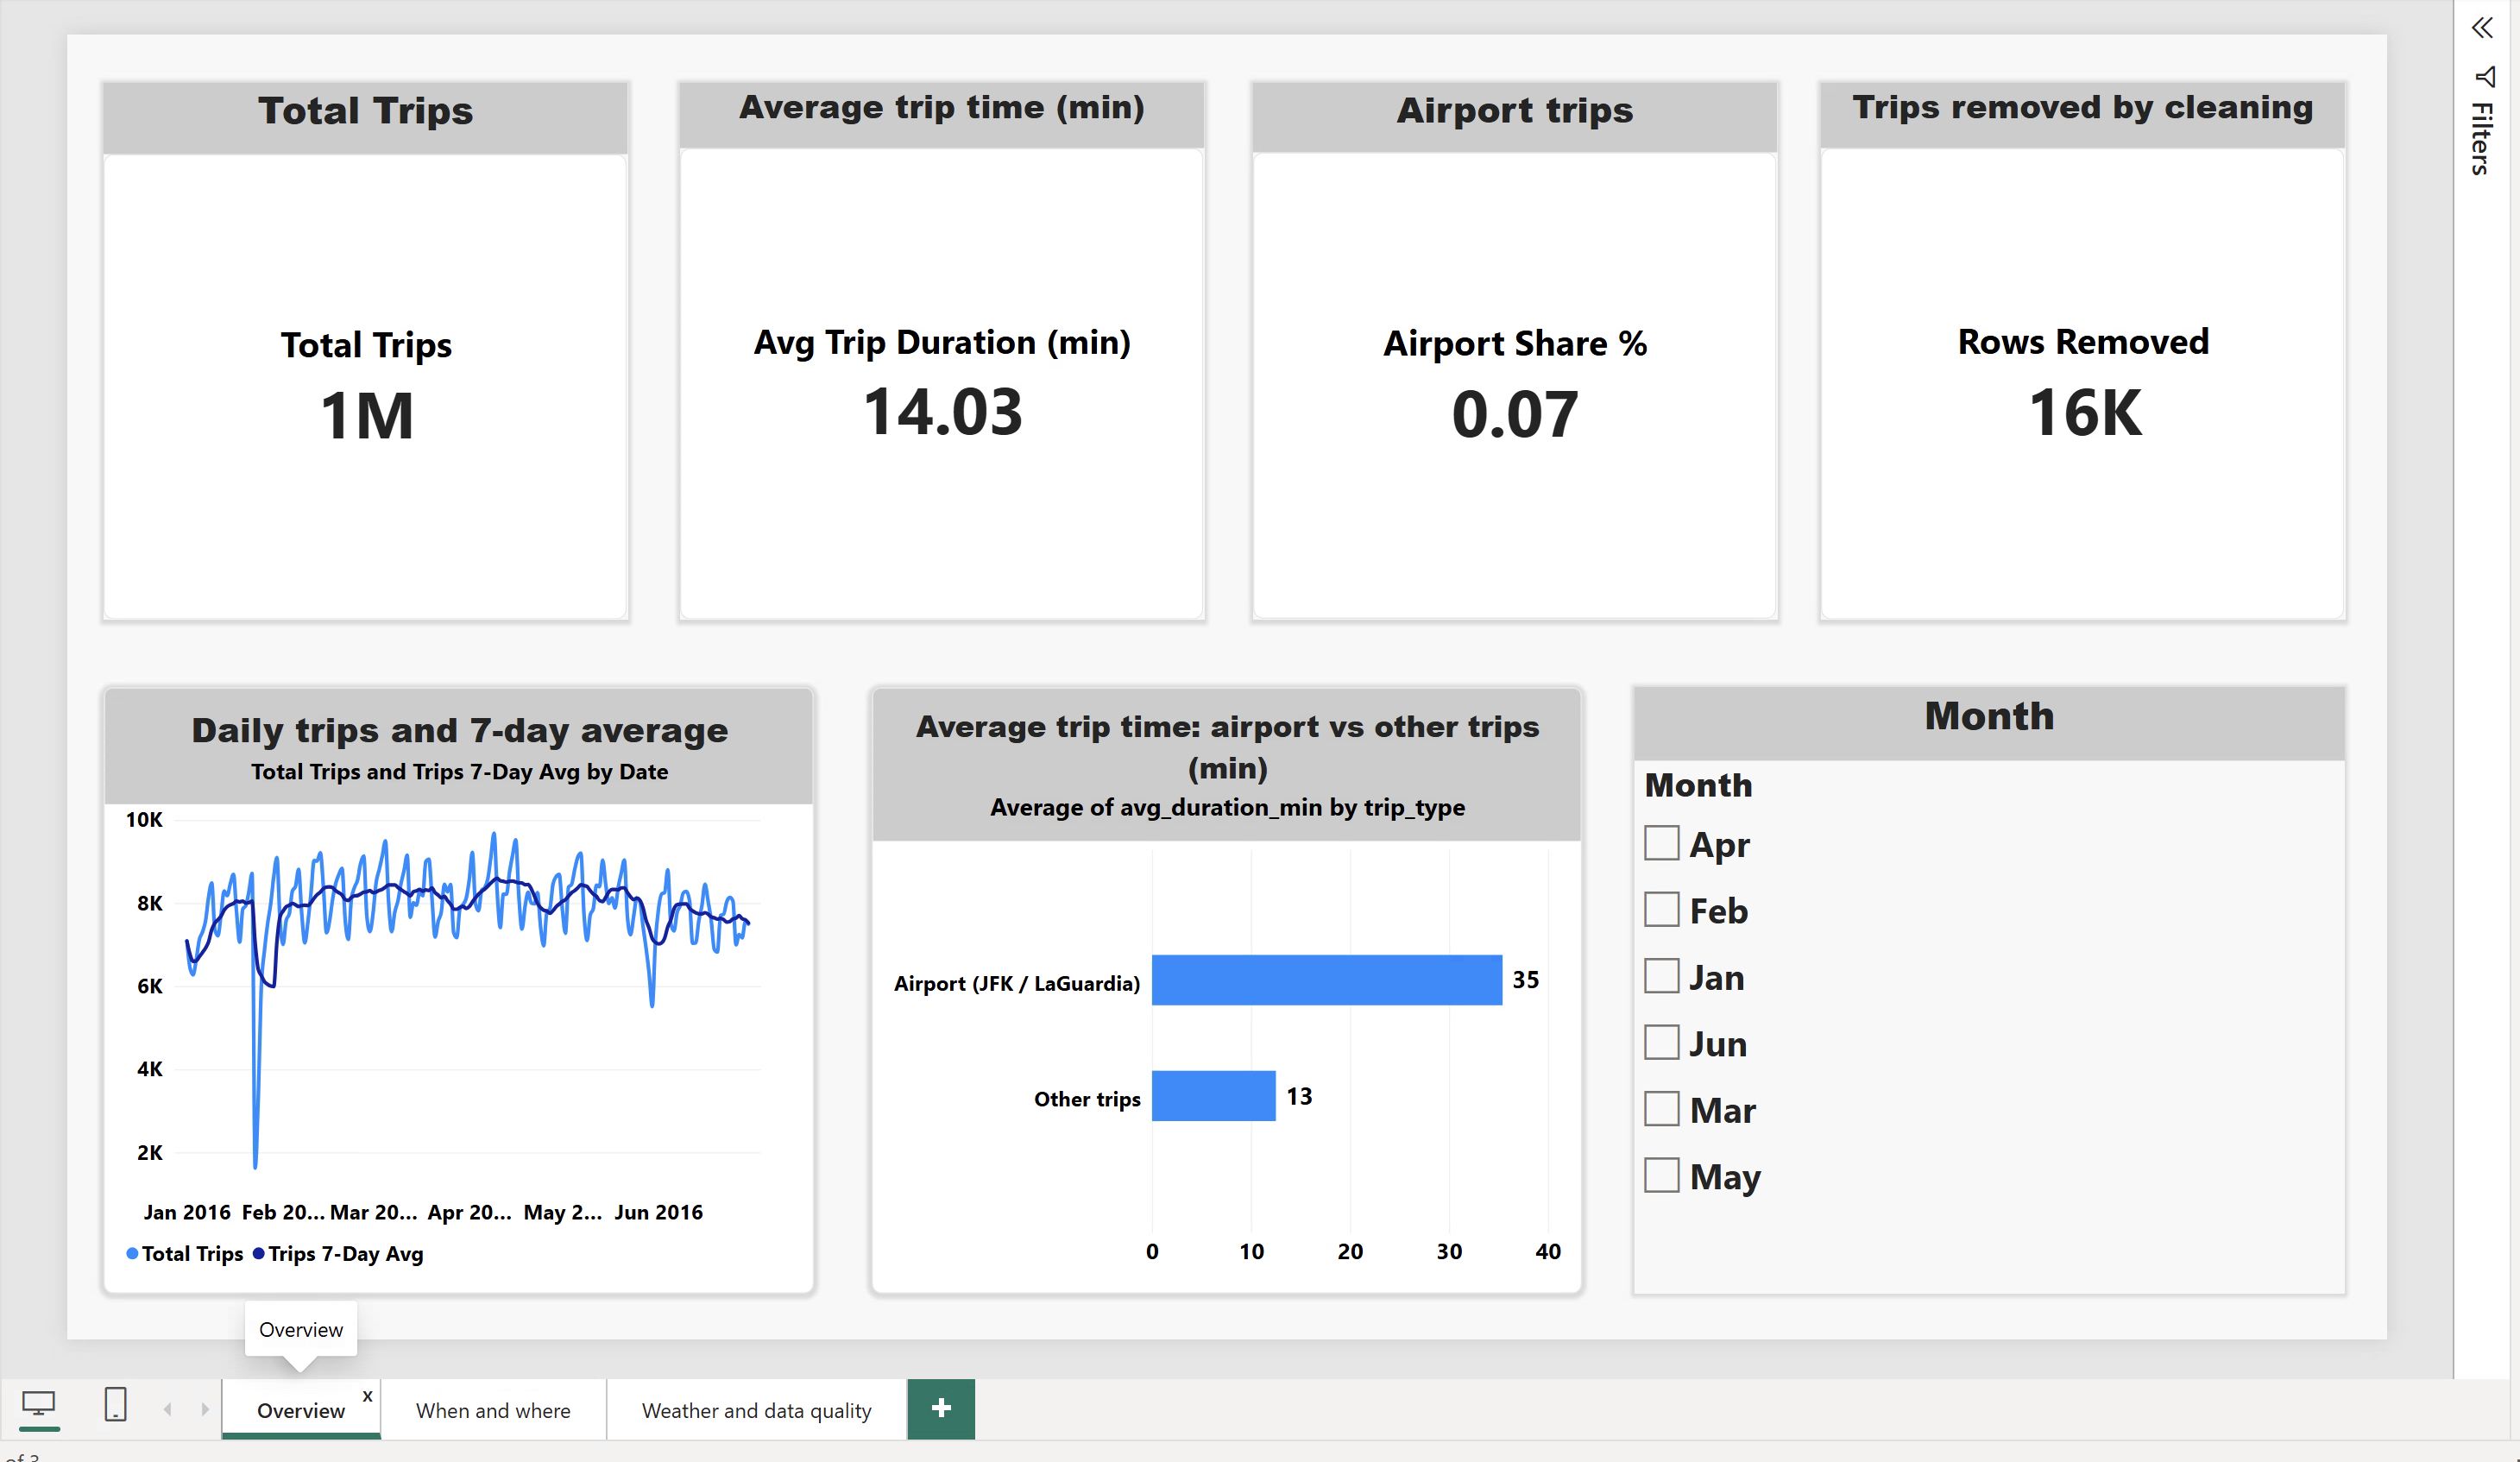
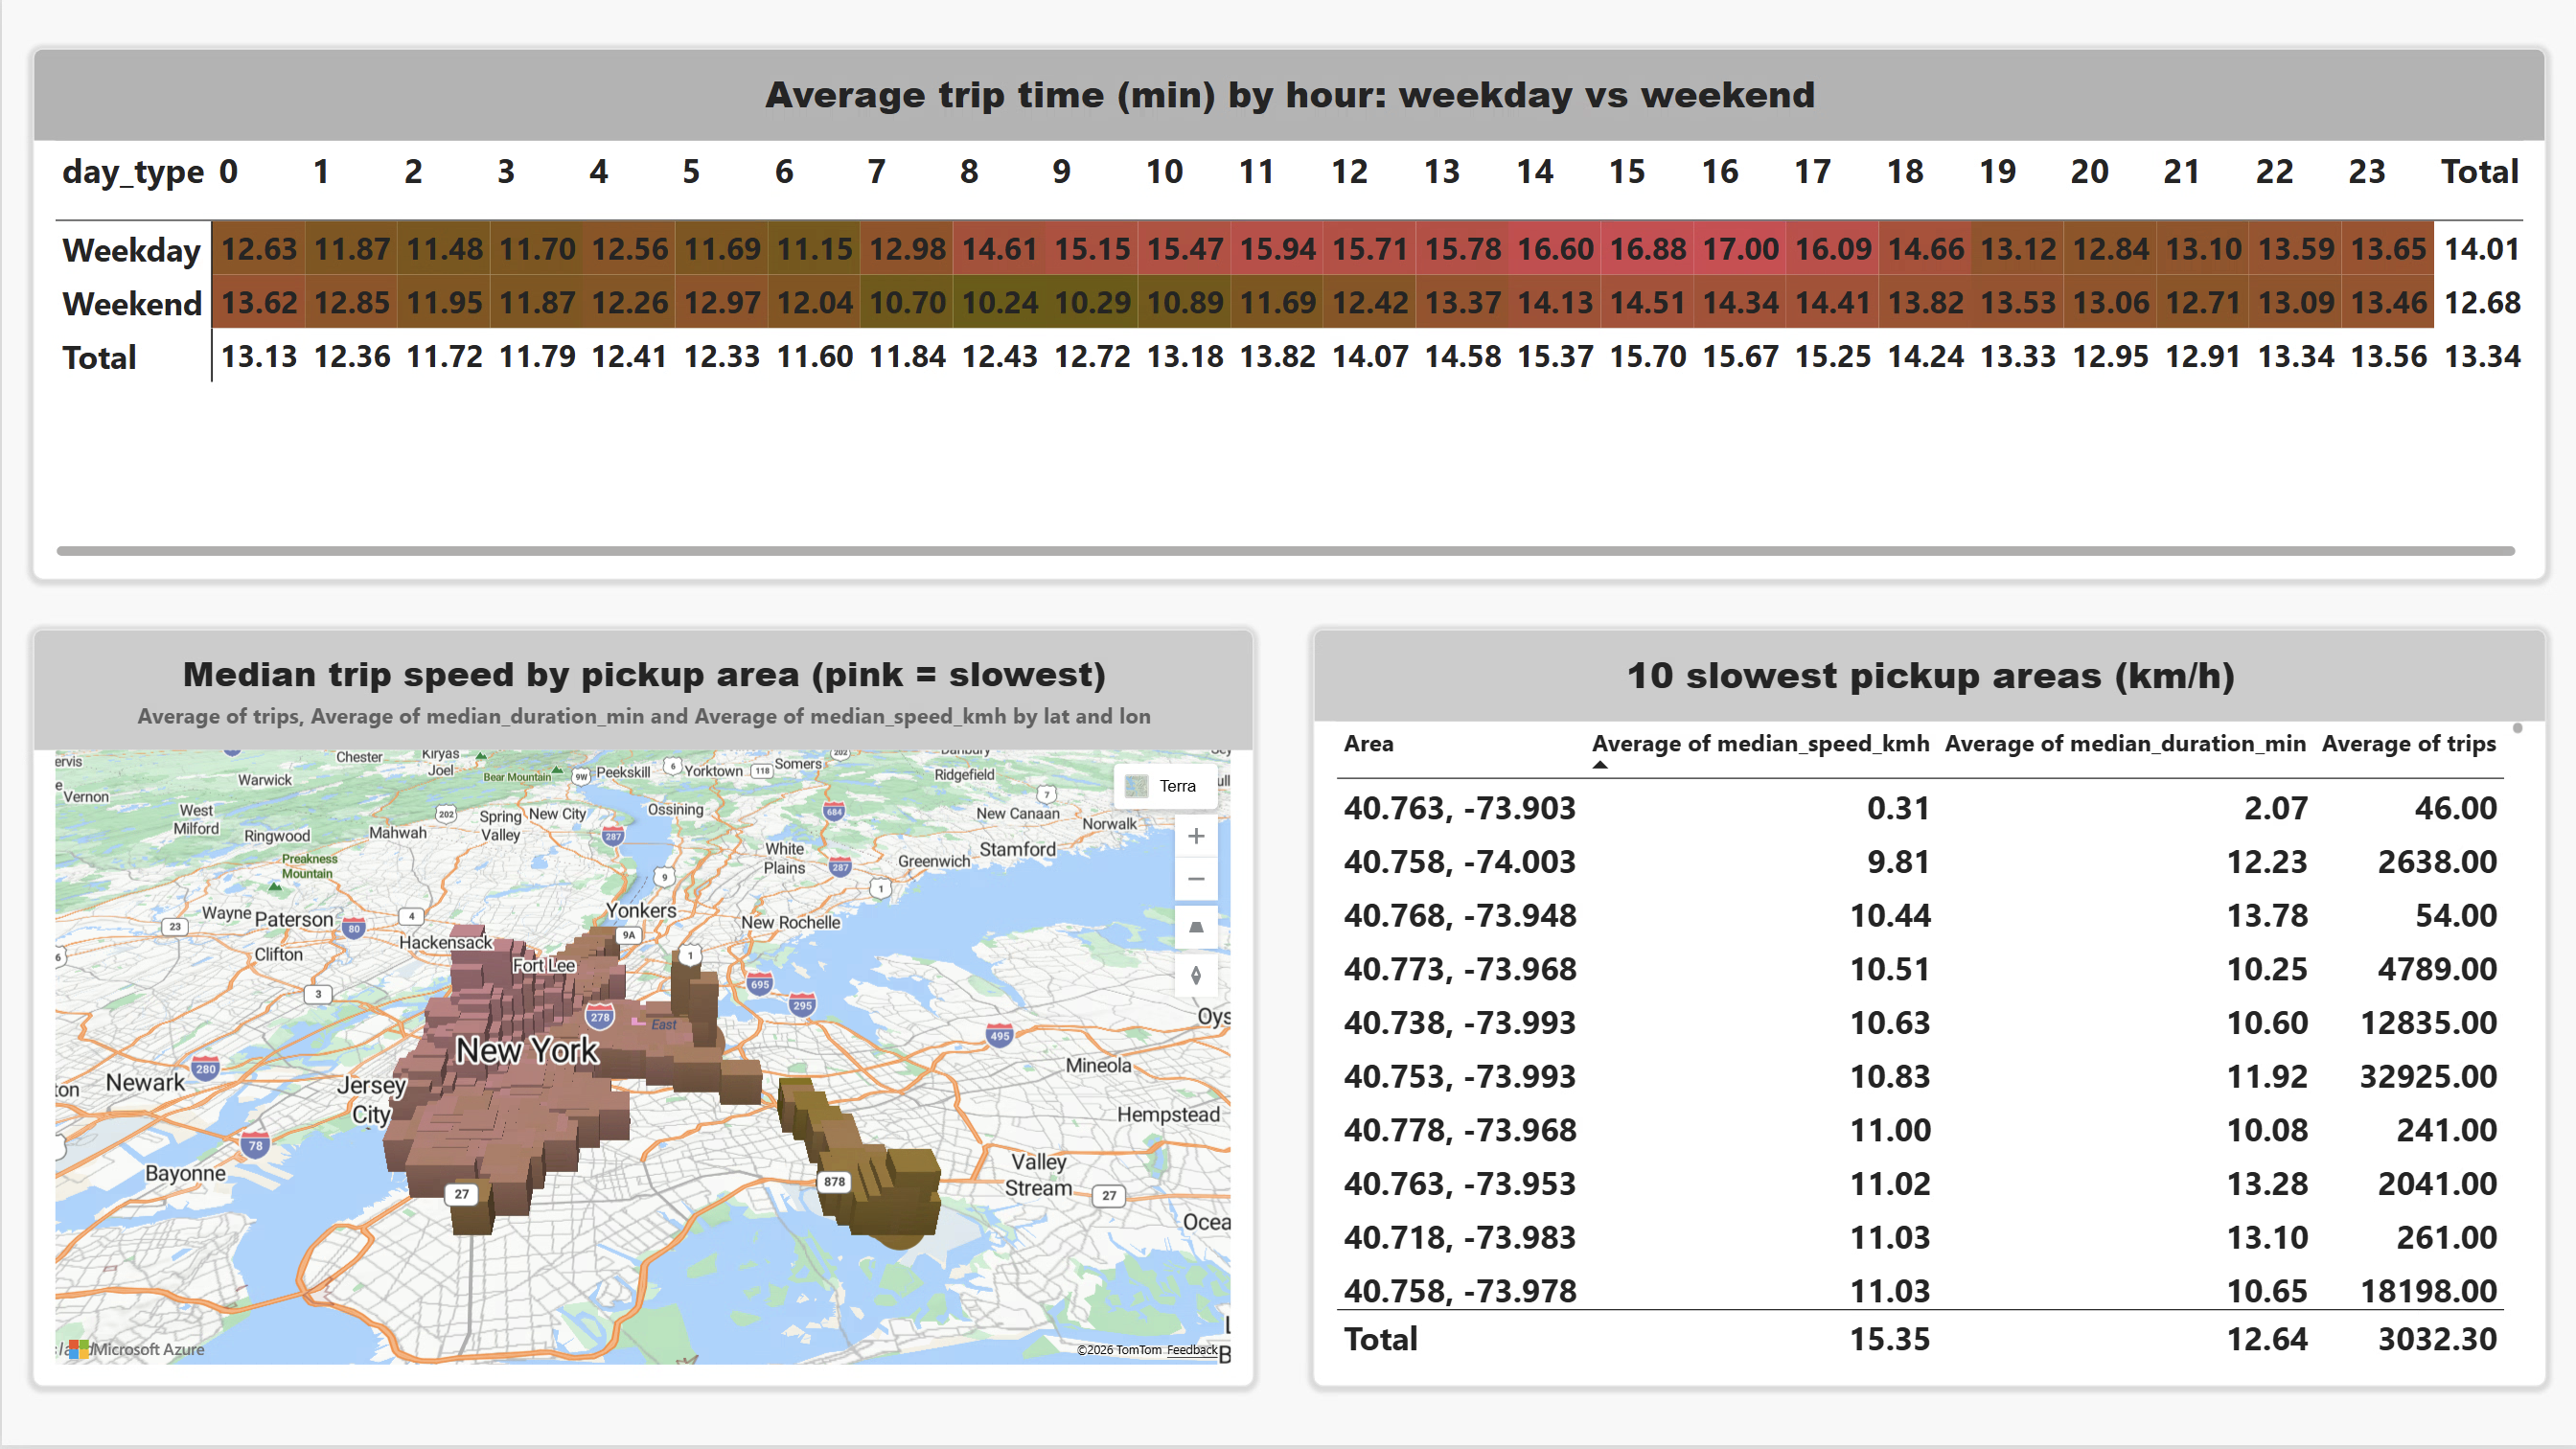
| Overview | When and where |
|---|---|
 |
 |
- Overview: 1,442,940 clean trips; airport trips are 6.6% of all trips and take 35.4 minutes on average vs 12.5 for other trips; the January blizzard shows as a sharp dip in daily trips.
- When and where: an hour × weekday/weekend heatmap (weekday afternoons are slowest, about 17 minutes at 4 p.m.) and a map of median speed by pickup area.
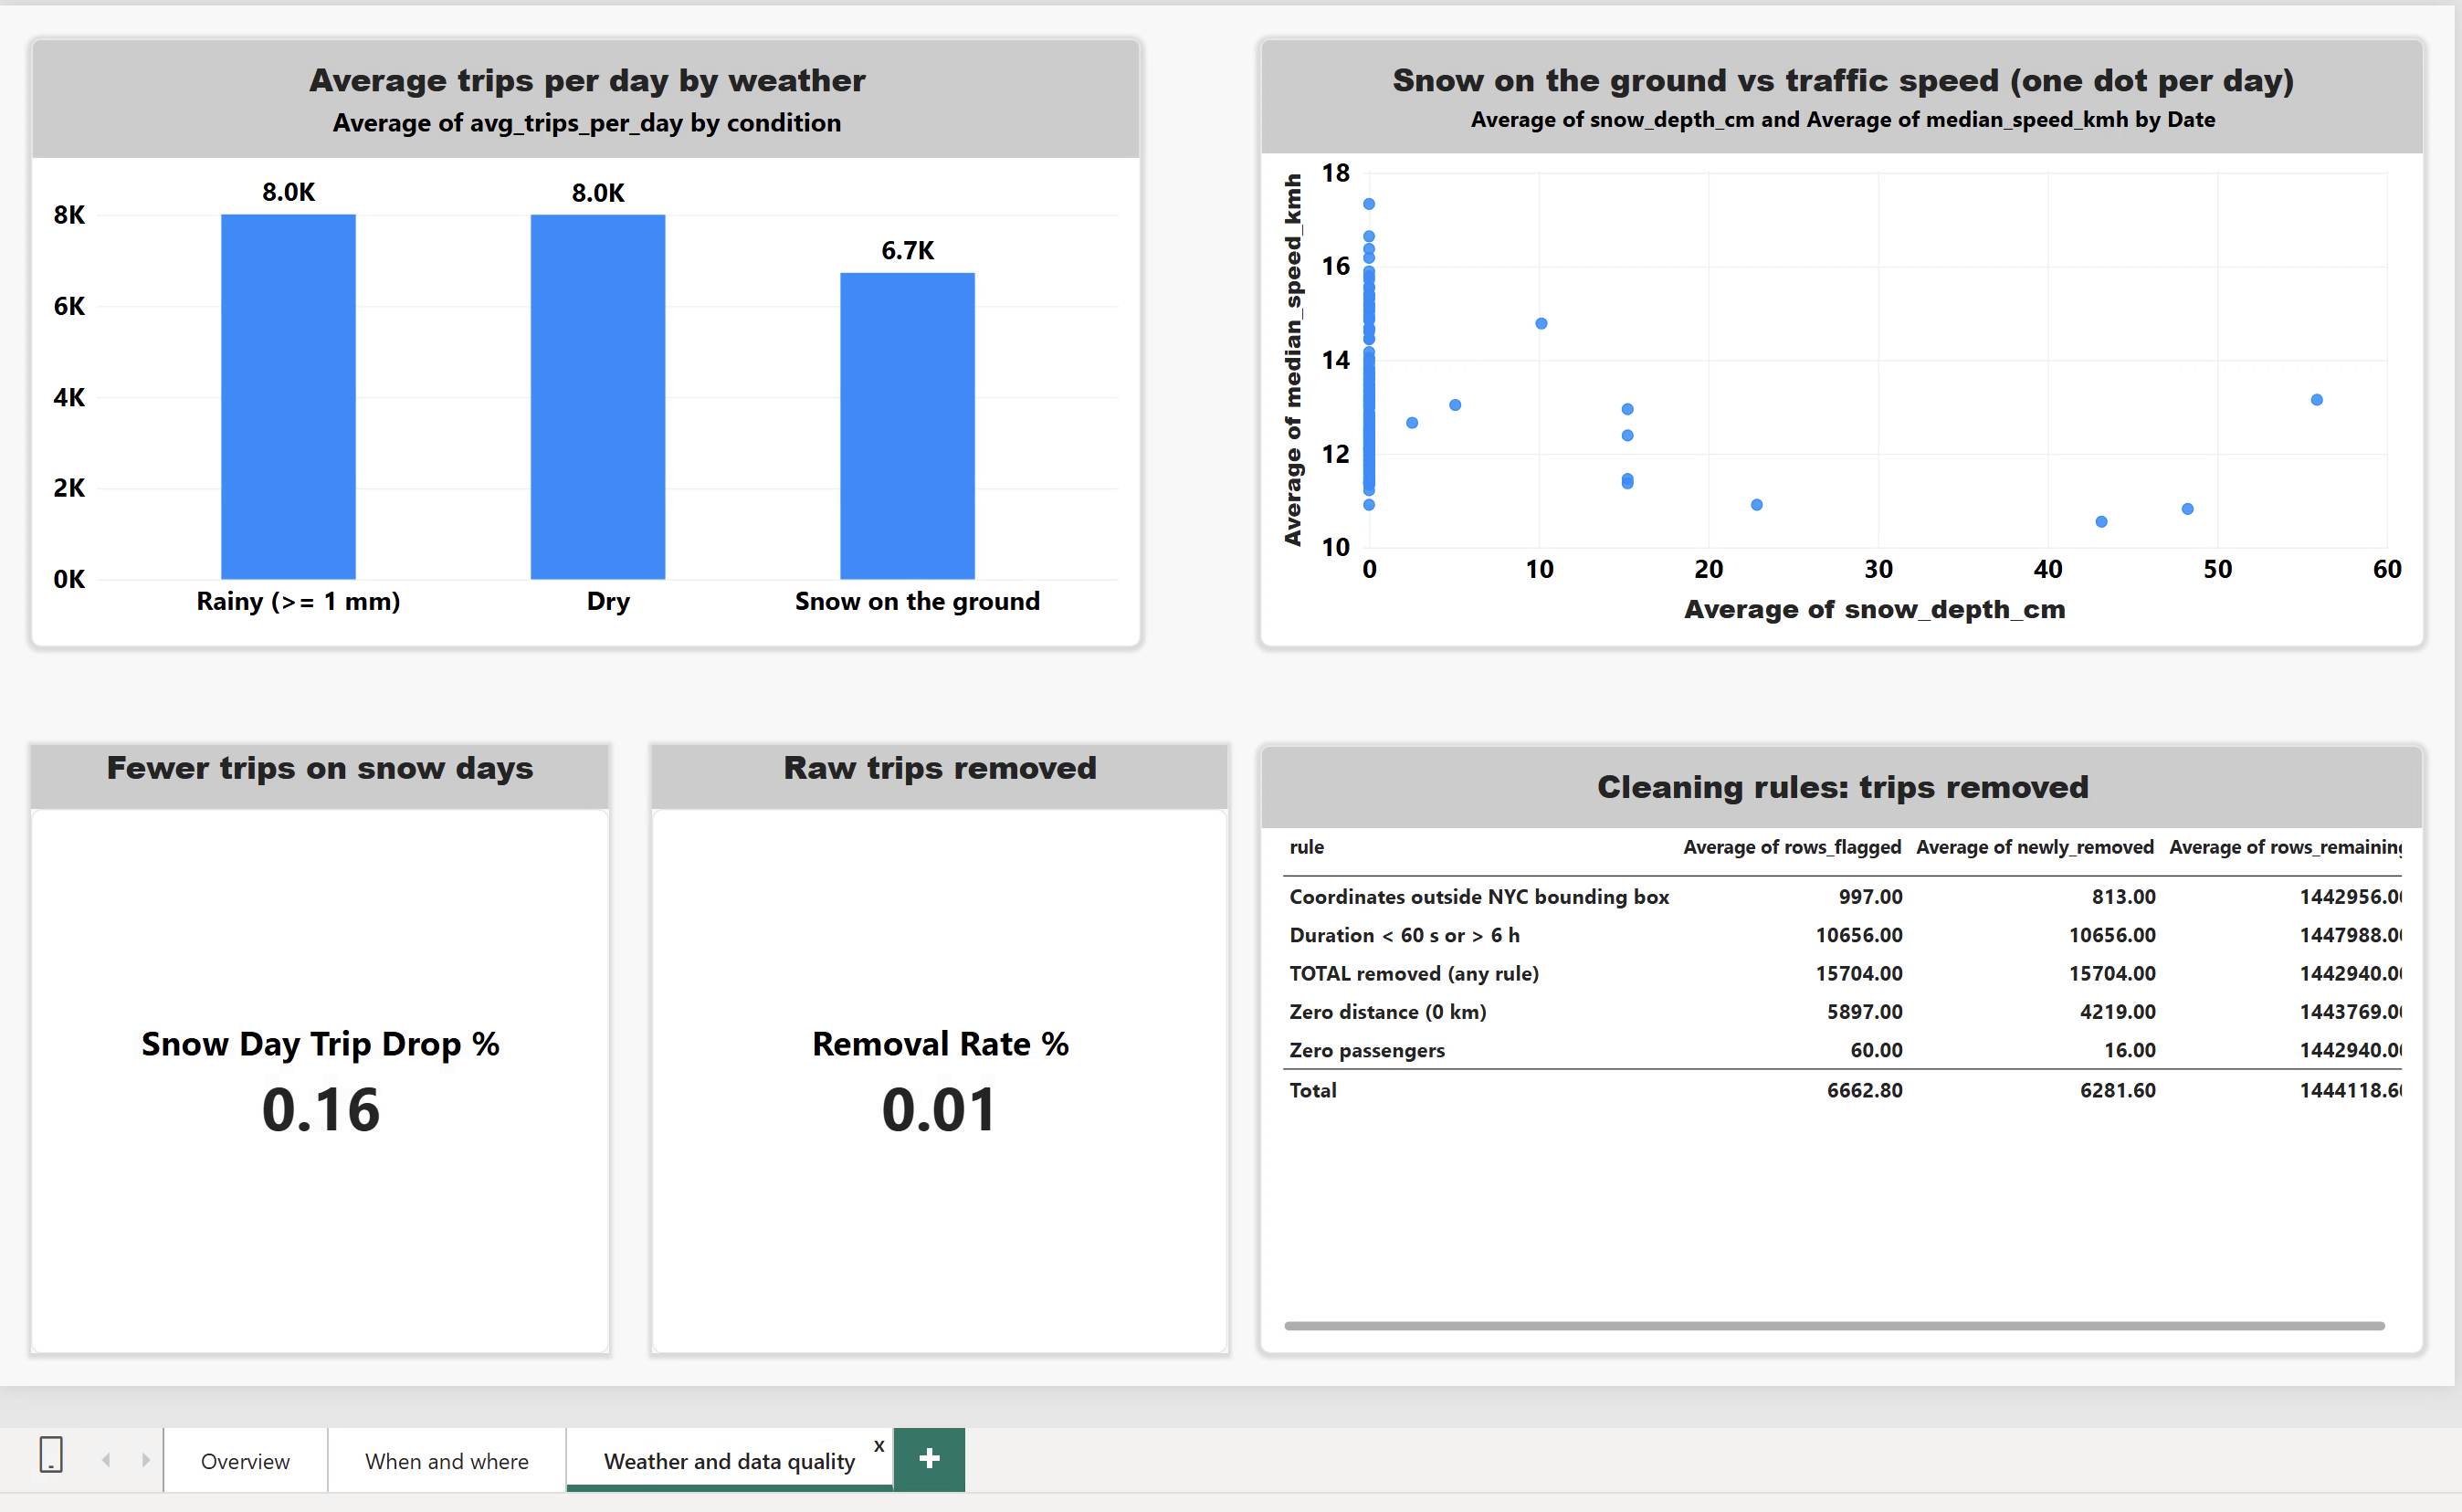
- Weather and data quality: days with snow on the ground had 16% fewer trips; rainy days were not slower; 1.1% of raw trips failed the cleaning rules.
- DAX: a marked date table, a 7-day rolling average (
DATESINPERIOD), a trip-weighted average duration (SUMX), and filtered share measures (CALCULATE).
The report file and a PDF export are in azure/powerbi/; the PDF opens without Power BI.
Security and cost
- No keys in code. Data Factory reads and writes the lake with its managed identity; Databricks uses a Unity Catalog storage credential backed by an Access Connector (a managed identity with the Storage Blob Data Contributor role) and three external locations, one per container.
- Runs on Azure for Students credit. Serverless Databricks charges only while the notebook runs (a full run takes a few minutes); storage and Data Factory cost cents per month.
- Why serverless: the student subscription could not start classic clusters in Canada Central (the available VM sizes were out of capacity), so the notebook runs on Databricks serverless compute, which also avoids managing clusters.
What is not automated yet
The Data Factory pipeline (ingestion and the row-count check) runs on a weekly schedule; the Databricks notebook is currently run on demand after ingestion. Connecting it as the final pipeline step is listed under future work.
More screenshots: successful run, trigger, lake containers, Databricks results
| Successful pipeline run | Weekly trigger | |---|---| |  |  | | Landing container | Silver container | Gold container | |---|---|---| |  |  |  | | Bronze row count | Results: airport, weather, slowest days | |---|---| |  |  |Experiment tracking
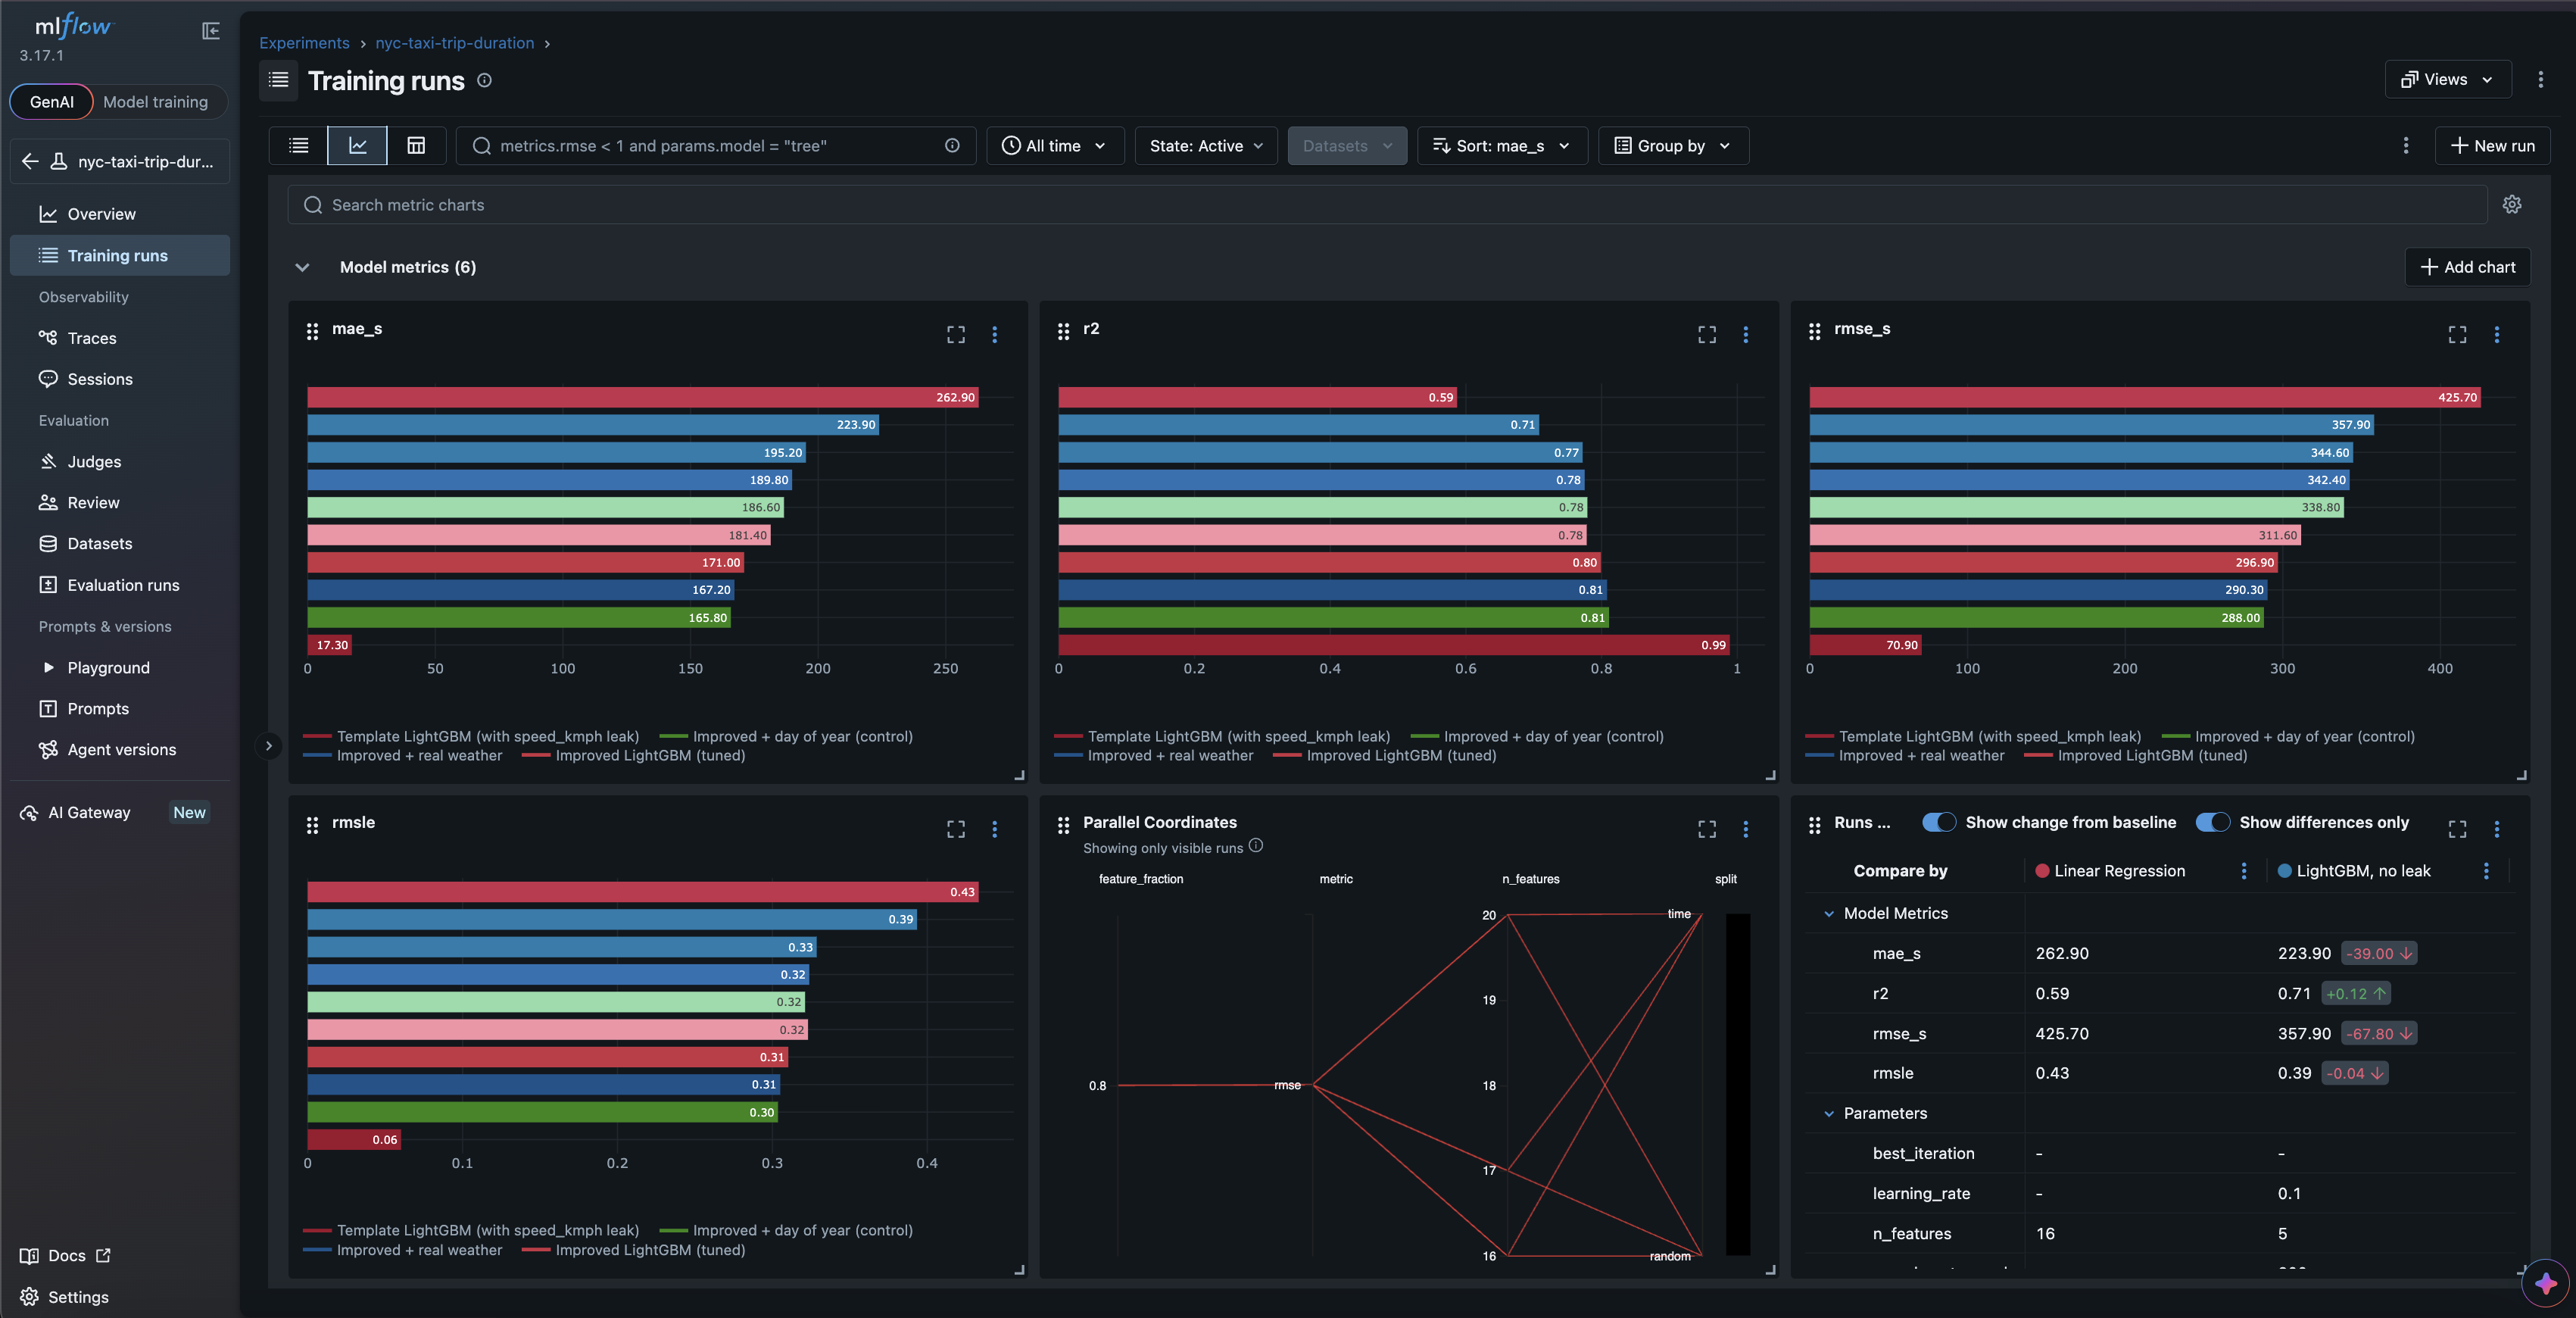
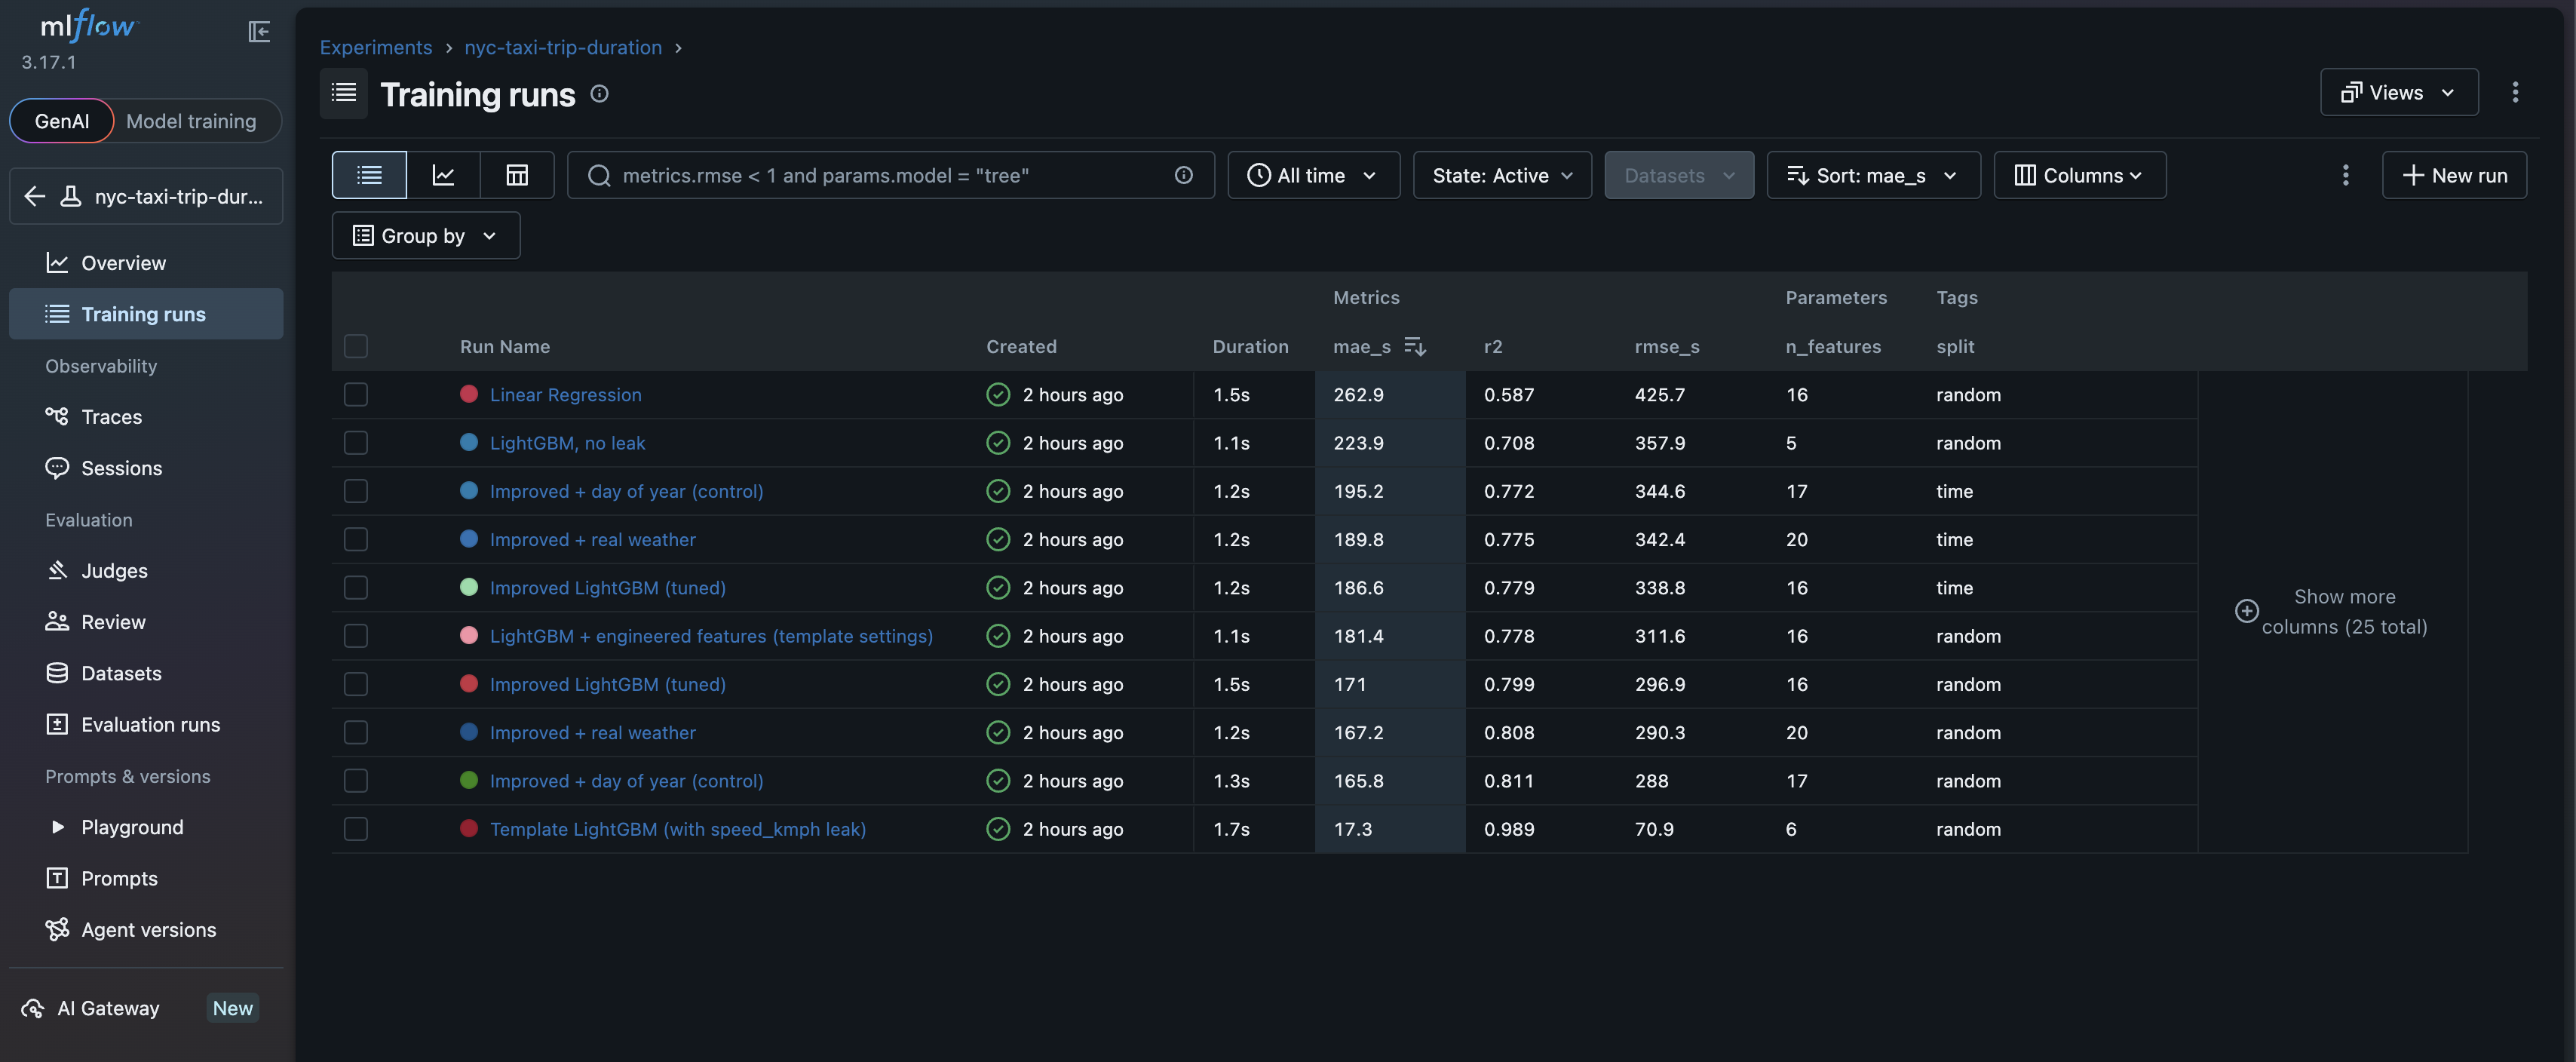
Every model run is logged to MLflow with its parameters, metrics, feature list, git commit and model file (10 runs per pipeline run: baselines, the tuned model, Linear Regression, and weather experiments on both splits).
mlflow ui --backend-store-uri sqlite:///mlflow.db --port 5001
Limitations
- Old, short period. Trained on January–June 2016 only. Seasons outside those months were never seen, and traffic in NYC has changed since 2016 (ride-hailing growth, congestion pricing).
- Long trips are underestimated. Trips over an hour are predicted about 21 minutes too short on average. They are rare (0.7%), and their causes (accidents, detours, waiting) are not in the data.
- No live conditions. The model knows nothing about weather, events, road closures or current traffic; it should not be relied on in situations like the January 2016 blizzard.
- Straight-line distances. Haversine and Manhattan distances, not the actual road route.
- Random-split headline number. The tuned model is evaluated on a random split for comparability with the course version; the realistic expected error for future trips is the time-split MAE (186.6 s).
- Point predictions only. No uncertainty range is given with a prediction.
- Demo-level API security. The live API is public with no authentication or rate limiting (usage is capped by Lambda concurrency and a budget alert), and the first request after a quiet period takes a few seconds (cold start).
- Deployment from a local machine. AWS deployment runs from a laptop with long-lived access keys rather than from CI with short-lived credentials.
- Library compatibility. PySpark 4.2 does not yet officially support pandas 3; results are verified by the Spark/pandas parity tests.
Future work
- Azure: run the Databricks notebook as the final Data Factory step, so the weekly run goes from raw files to refreshed Power BI tables without manual steps.
- Better accuracy: road distances and travel times from a routing engine (e.g. OSRM), hourly weather and event data, and quantile models that return a time range instead of a single number.
- Honest model selection: rolling time-based validation (backtesting over several months) to choose features and settings, and retraining on the most recent data.
- More, newer data: the full NYC TLC trip records (billions of trips, through recent years) with the Spark pipeline on a cluster (AWS EMR or Databricks).
- MLOps: MLflow model registry with champion/challenger promotion, and monitoring of input drift and prediction error from the API logs.
- Secure, automated deployment: deploy from GitHub Actions using OIDC short-lived credentials and a least-privilege IAM role (no long-lived access keys), with infrastructure as code (AWS SAM or Terraform).
- Production API: authentication and rate limiting (API Gateway), batch predictions, and provisioned concurrency to avoid cold starts.
- Orchestration: an Airflow version of the DAG, and running the Prefect flow on a server instead of a laptop.
Project structure
├── README.md
├── config.yaml                  # paths, validation and cleaning thresholds, model settings
├── requirements.txt             # main packages (requirements-lock.txt: exact versions)
├── requirements-api.txt         # API image packages, pinned to the training versions
├── requirements-dev.txt         # pytest, ruff, httpx
├── pyproject.toml               # pytest and ruff settings
├── Dockerfile                   # API image (runs locally, in CI and on AWS Lambda)
├── .github/workflows/ci.yml     # lint + tests + Docker smoke test on every push
├── src/
│   ├── config.py                # loads config.yaml
│   ├── etl.py                   # load, validate, clean (SQL, verified against pandas)
│   ├── schemas.py               # pandera data contracts (raw, clean, features)
│   ├── features.py              # 16 features, shared by training and the API
│   ├── db.py                    # runs the SQL files with DuckDB
│   ├── train.py                 # random and time-based splits, models, evaluation
│   ├── tracking.py              # MLflow experiment tracking
│   ├── explain.py               # SHAP explanations
│   ├── plots.py                 # figures and speed maps
│   ├── model_card.py            # writes reports/model_card.md
│   ├── spark_etl.py             # PySpark version of cleaning + features
│   ├── steps.py                 # the pipeline steps (each reads and writes files)
│   └── pipeline.py              # runs everything: python -m src.pipeline
├── sql/                         # DuckDB: cleaning, views, 6 analysis queries
├── flows/pipeline_flow.py       # scheduled Prefect flow (the pipeline as a DAG)
├── api/
│   ├── main.py                  # FastAPI app: /, /predict, /health
│   ├── schemas.py               # request validation (Pydantic)
│   ├── model.py                 # loads the model from a file or S3
│   └── static/index.html        # interactive map page
├── deploy/                      # AWS Lambda deploy and teardown scripts
├── azure/
│   ├── adf/                     # Data Factory pipeline, datasets, linked service, trigger (JSON)
│   ├── databricks/              # bronze → silver → gold notebook (PySpark)
│   └── powerbi/                 # report (.pbix) and PDF export
├── docs/deploy_aws.md           # deployment guide
├── scripts/
│   ├── download_data.py         # downloads and verifies the Kaggle data
│   ├── benchmark_storage.py     # CSV vs Parquet benchmark
│   ├── make_test_fixtures.py    # synthetic test data with planted problems
│   ├── make_demo_model.py       # small model for tests and CI
│   └── pin_api_requirements.py  # pins the API image to training versions
├── tests/                       # 91 pytest tests + synthetic fixtures
├── examples/                    # sample API request
└── reports/
    ├── model_card.md            # generated model card
    ├── metrics.json             # generated metrics
    ├── speed_map.html           # interactive speed map
    └── figures/                 # SHAP, map, results, CI, MLflow, Prefect, AWS
Data sources and background
- NYC Taxi Trip Duration (Kaggle competition data, January–June 2016)
- Weather data in New York City – 2016 (Central Park station, US National Weather Service)
The data is downloaded by scripts/download_data.py and is not stored in this repository.
License: code under MIT. The data is subject to Kaggle’s terms and is not redistributed.